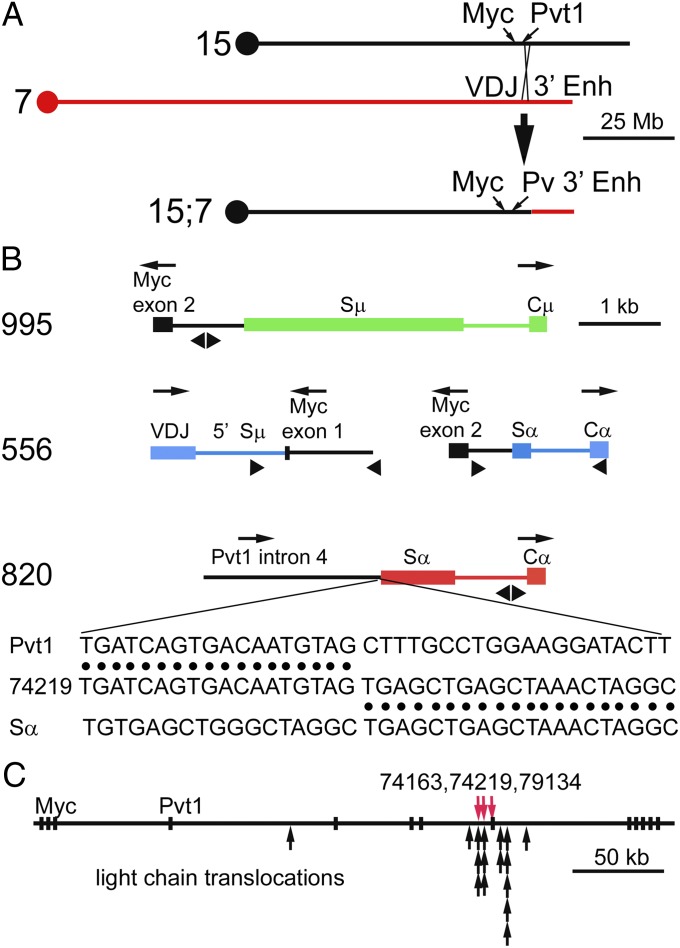
Fig. 3.
Molecular characteristics of translocations between the Igh transgene and Myc. (A) Schematic diagrams of Chr 15 with the approximate location of the Myc and Pvt1 genes, Chr 7 with the Igh transgene, and the resulting derivative Chr 15 after translocation. (B) Molecular clones of translocations to the Igh transgenes. These molecular clones are from primary tumor no. 4816 (line 995), from primary tumor no. 1854 [line 556, both der (15) and der (17) translocation products], and from tumor no. 74219 (line 820). Igh transgenic sequences at the translocation site are color coded according to the chromosome on which the transgene resides. Myc- or Pvt1-associated sequences (Chr 15) are shown in black. The transcriptional direction of each gene is shown above each schematic. Triangles below each schematic approximate the location of PCR primers used to clone these translocation sites. The sequence data corresponding to the structure shown in the line 820 schematic is presented below the schematic. Sequence data for other translocation sites in tumors are shown in Table S2. (C) Structure of the Myc and Pvt1 loci on Chr 15. Exons are depicted as black rectangles. The Myc gene is encoded by the three exons on the left of the map; the Pvt1 transcripts are encoded by the next exon designated “Pvt1” and the remaining nine exons (and additional exons not included in this figure). The translocation sites in tumors 74163, 74219, and 79134 are shown as red arrows. Translocation sites to light chain genes in plasmacytomas (25) are shown below as black arrows.

