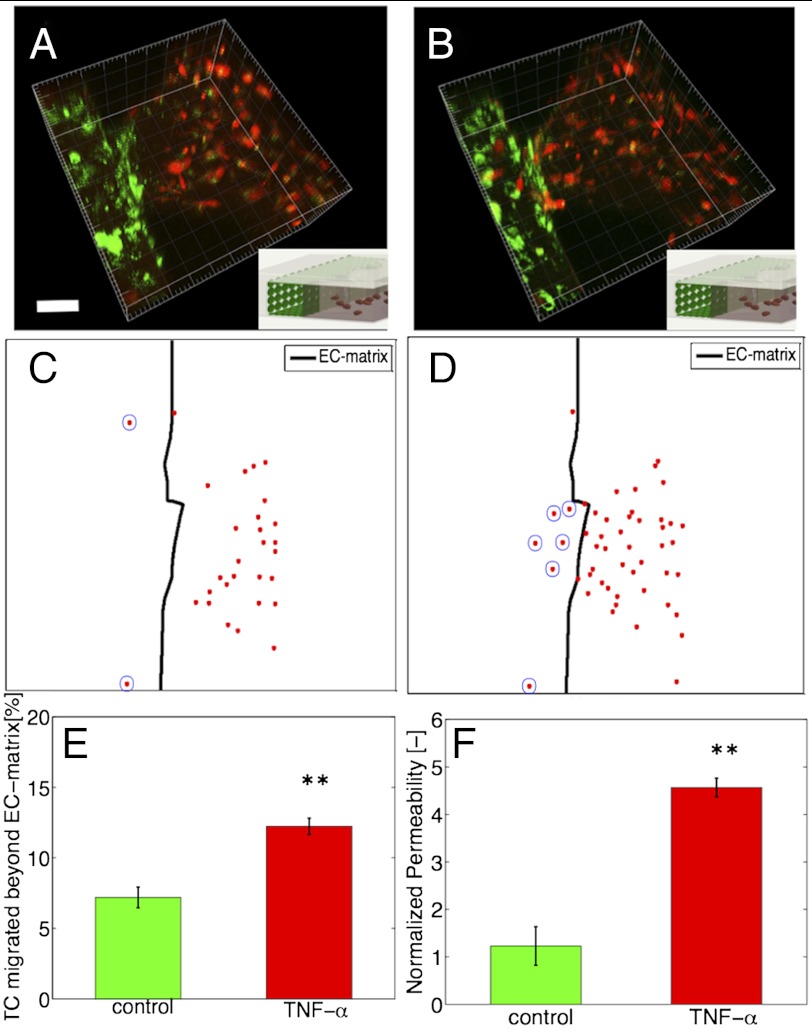
Fig. 4.
TNF-α effects on tumor-endothelial interactions and endothelial permeability. (A and B) Three-dimensional rendering of a single hydrogel region showing fibrosarcoma tumor cells (HT1080, red) next to endothelial monolayer (MVEC, green) at time t = 0 h (A) and t = 10 h (B). Inset shows image orientation in the device. (Scale bar: 50 μm.) (C and D) Projected confocal slices showing all tumor cells (red dots) located within 250 μm from the 3D ECM-endothelial channel interface (outlined with a thick black line) at t = 0 h (C) and t = 10 h (D). (Scale bar: 50 μm.) (E) Percentage of tumor cells that interacted with the endothelium to the total cells in the hydrogel region (P = 0.006). Average values (n = 3 devices) for each condition. (F) Normalized change in permeability after 10 h, for the control and TNF-α conditions (P = 0.002). Average values for at least n = 10 hydrogel regions; error-bars represent SEM.

