Fig. 5.
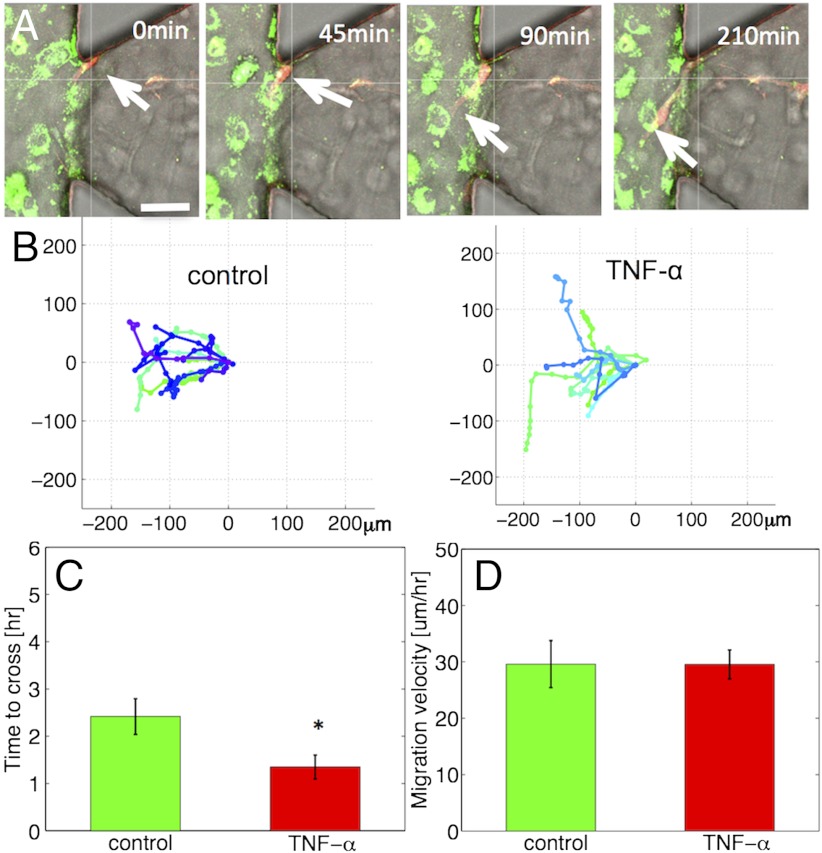
Dynamics of tumor-endothelial interactions. (A) Time series of confocal images showing a HT1080 cell (red, white arrow) invading toward the TNF-α stimulated endothelial monolayer (MVEC, green). (Scale bar: 50 μm.) (B) Tumor cell trajectories over 10 h under control (Left) and TNF-α conditions (Right). (C) Time required for tumor cells to migrate over a 60 μm distance across the EC-matrix (P = 0.02). (D) Mean migration speed of HT1080 cells in the 3D matrix (P = 0.99). Average values for at least n = 10 trajectories per condition in A–D; error-bars represent SEM.

