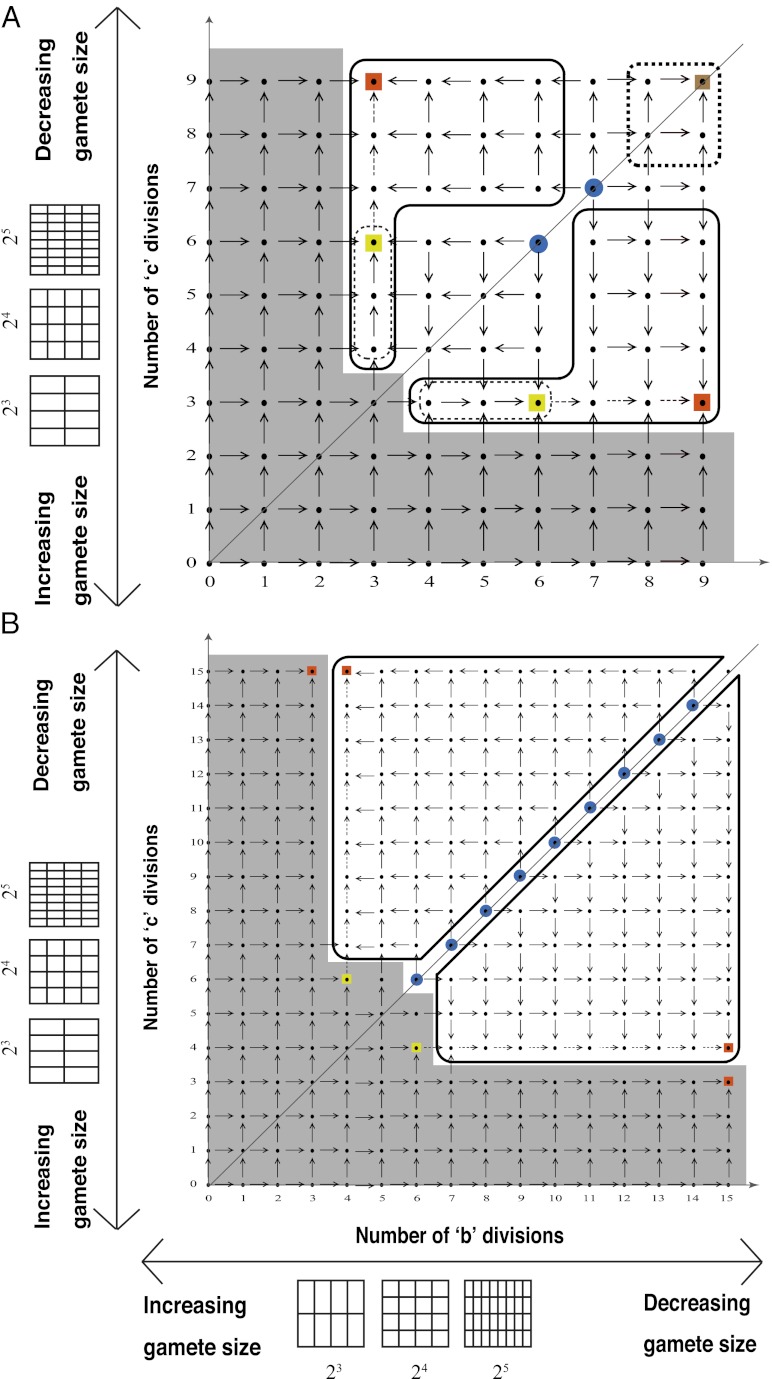
Fig. 3.
Typical evolutionary trajectories of gamete size when (A) the zygote survival is not related to the individual zygote mortality rate and (B) the per unit volume male gamete contribution to the zygote survival is smaller than the female contribution. (A) Eq. S17 is used instead of Eq. S16. The contribution of gametic resources per unit volume to the zygote survival is equal between the sexes ( ) as in Fig. 2. Parameter conditions:
  ,
,  , and
, and  .
.  , an environmental parameter of the zygote survival probability function (Eq. S17). Fig. 2 explains the other parameters. (B) The zygote survival probability function is Eq. S16. Parameter conditions:
  ,
,  ,
,  , and
, and  .
.  , the ratio of the contribution of resources of a male gametes per unit volume to the contribution of a female gamete.
  means that provisioning of resources of a zygote from a male gamete is 70% of the rate of provisioning of a female gamete per unit volumes. Fig. 2 explains the arrows, symbols, and areas surrounded by solid and dotted lines.

