Fig. 4.
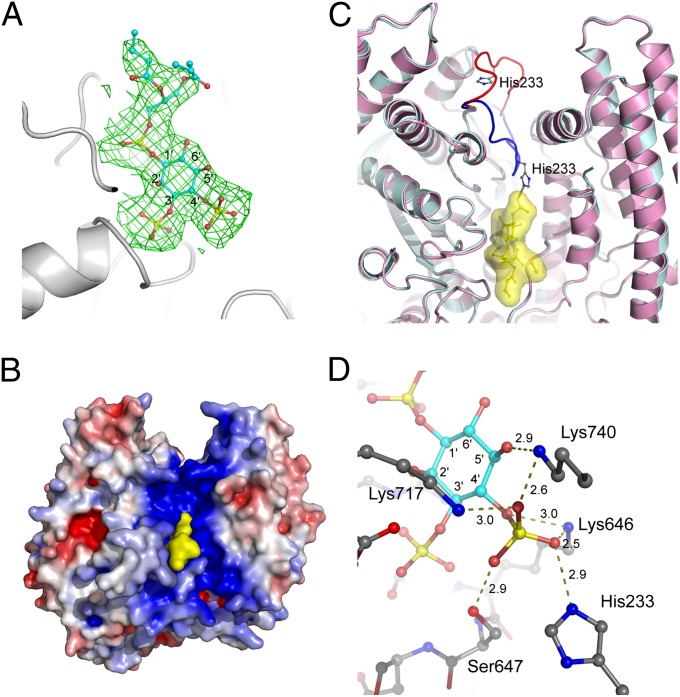
Substrate recognition by SidF. (A) Difference electron density map (Fo−Fc at 3σ, green mesh) calculated near the catalytic site. The substrate diC4-PI(3,4)P2 molecule shown in sticks fits nicely in the electron density. (B) A view of the SidF–substrate complex represented in surface. The substrate colored in yellow binds deeply in the positively charged groove at the catalytic site. (C) The binding of substrate induces a large conformation change of a loop containing residue His233. The apo structure is shown in pink with the His233 loop shown in red. The complex structure is colored in cyan with the corresponding loop in blue. The diC4-PI(3,4)P2 molecule is shown in sticks and enveloped in a yellow surface. His233 forms a hydrogen bond with the D4 phosphate group of the substrate. (D) Specific recognition of the D4 phosphate group of the substrate. Five residues (Lys717, Lys740, Lys466, Ser647, and His233) form a basic pocket that holds the D4 phosphate through an intensive hydrogen bond network and electrostatic interactions. Hydrogen bonds are indicated by dashed lines, and the distance in Å is labeled.

