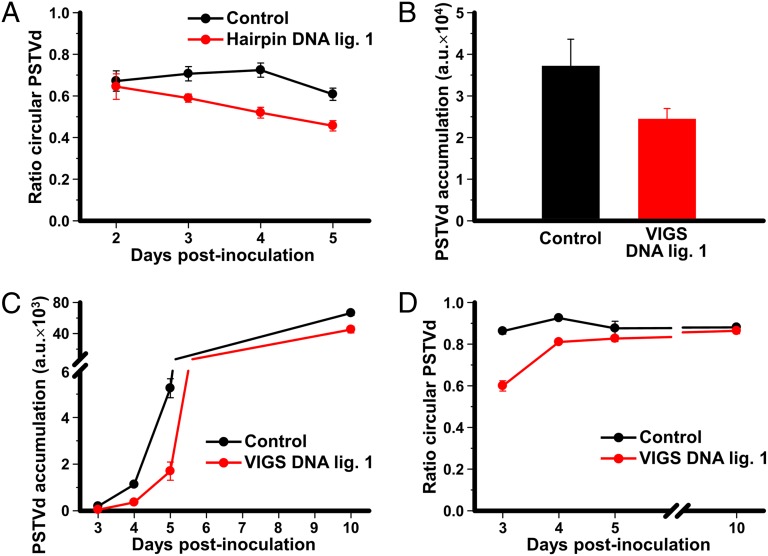
Fig. 4.
Effect of DNA ligase 1 silencing on the in vivo accumulation and circularization of PSTVd. (A) Interference with circularization of PSTVd RNA caused by the expression of a DNA ligase 1 hairpin. A dimeric PSTVd construct was coagroinoculated in N. benthamiana with either a tomato DNA ligase 1 hairpin construct to silence the endogenous gene (red), or with the empty vector (black). RNAs were purified from the agroinfiltrated areas of triplicate plants and separated by denaturing PAGE. Monomeric circular and linear PSTVd forms were visualized by Northern blot hybridization and quantified by phosphorimetry. The plots represent the ratio of monomeric circular to total monomeric PSTVd forms (circular plus linear) at several days postinoculation (dpi). (B–D) Interference with PSTVd accumulation and circularization caused by the expression of a VIGS construct specific for the endogenous DNA ligase 1. (B) A dimeric PSTVd construct was coagroinfiltrated in N. benthamiana 16c plants constitutively expressing GFP with either a Tobacco rattle virus construct to induce VIGS of DNA ligase 1 and GFP (red histogram) or a control construct to induce VIGS of GFP alone (black histogram). At 1 mo postinfiltration, RNA was extracted from quadruplicate samples of upper noninoculated leaves, separated by denaturing PAGE, and the monomeric circular and linear PSTVd forms detected by Northern blot hybridization and quantified as indicated above. Histograms represent PSTVd accumulation in arbitrary units (a.u.). (C and D) N. benthamiana 16c plants constitutively expressing GFP were preinoculated with the VIGS vectors to induce silencing of either the endogenous DNA ligase 1 and GFP (red) or GFP alone (control, black). At 3–4 wk later, GFP silenced plants were agroinfiltrated with a construct to express a dimeric PSTVd RNA. RNA was extracted at different time intervals from the agroinoculated areas of triplicate plants, and PSTVd forms were visualized by Northern blot hybridization and quantified. (C) Plot of total PSTVd RNA accumulation (in a.u.) vs. dpi. (D) Plot of the ratio of monomeric circular to total PSTVd monomeric forms vs. dpi. All plots include bars indicating the SD of the replicate measures.

