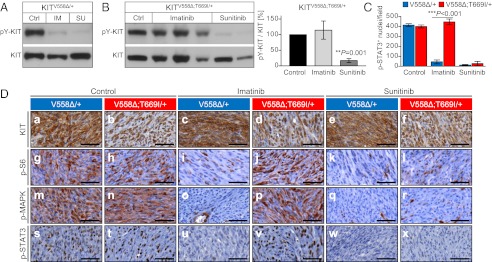
Fig. 3.
The KitV558Δ;T669I double mutation confers resistance to imatinib in vivo. Sunitinib overcomes resistance. (A and B) Tumor protein lysates from individual KitV558∆/+ (A) and KitV558∆;T669I/+ (B) (Left) animals treated for 6 h with vehicle (Ctrl), imatinib (IM), or sunitinib (SU) were subjected to Western blotting with phospho-Y719-KIT and KIT antibodies. Representative blots are shown. (Right) The ratio of phosphorylated to total KIT in GISTs of KitV558∆;T669I/+ mice after imatinib and sunitinib treatment was quantified by densitometry (n = 3–5 animals per treatment group; error bars indicate means ± SD). (C) Quantification of phospho-STAT3+ nuclei per field (cf. D s–x and corresponding explanations). n = 3 each; error bars indicate means ± SD. (D) Representative results of IHC analysis with antibodies specific for KIT (a–f), phospho-S6 ribosomal protein (g–l), phospho-MAPK (m–r), and phospho-STAT3 (s–x) on sections of GISTs from single- or double-mutant mice treated for 6 h with vehicle, imatinib, or sunitinib. Tumor sections from different treatment groups and genotypes (n ≥ 3 each) were placed next to each other on the same microscopy slide to enable cross-comparison of staining intensities. (Scale bars: 50 μm.)

