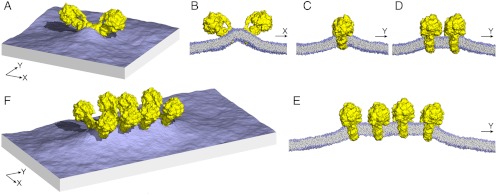
Fig. 5.
Membrane curvature induced by ATP synthase dimers. (A) perspective view of a simulated membrane patch with an ATP synthase dimer distorting the planar lipid bilayer. The simulation is based on a coarse-grained representation of the dimer structure and its environment (see Methods); for clarity, the solvent is omitted. (B, C) cross sections through the membrane patch in (A) showing the curvature profile of the lipid bilayer in x and y direction. (D) and (E), curvature profiles as in (C) for membranes with two or four ATP synthase dimers, side by side. Note how the membrane deformation in y direction is relieved when two or more dimers assemble into a row. (F) perspective view of the row of four dimers shown in (E). 2D curvature maps are compared quantitatively in Fig. S6.

