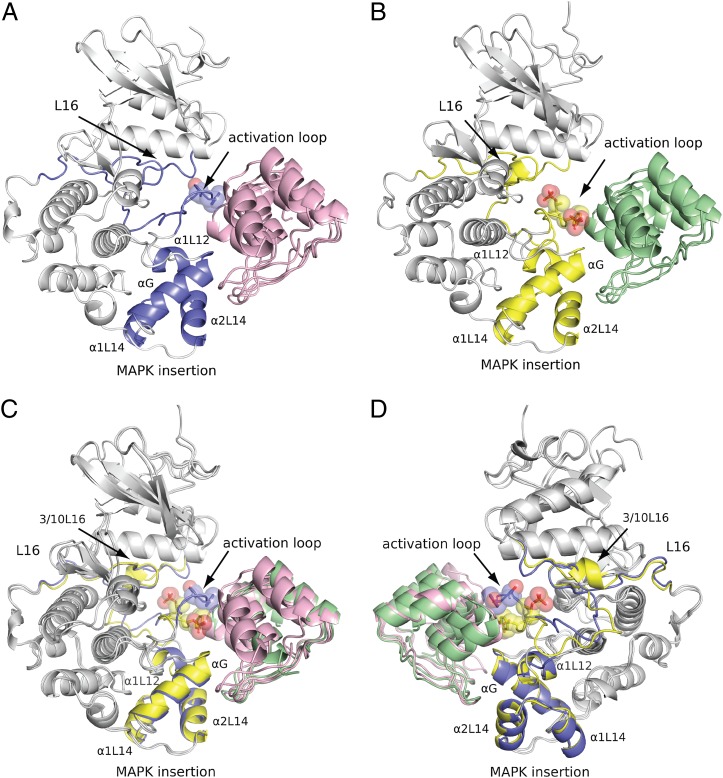
Fig. 2.
Crystal structures of phosphorylation status-specific DARPins E40 and pE59 in complex with ERK2 and phosphorylated ERK2. Segments of structural divergence taking part in interaction with DARPins are labeled and highlighted in ERK2 (blue) and pERK2 (yellow). The side chains of Thr-183, Tyr-185, pThr-183, and pTyr-185 are shown. (A) Ribbon diagram of E40 (magenta) in complex with ERK2 (gray and blue). (B) Ribbon diagram of pE59 (green) in complex with pERK2 (gray and yellow). (C and D) Two views (180° rotated) of the superimposed complexes E40/ERK2 and pE59/pERK2 are shown.

