Fig. 3.
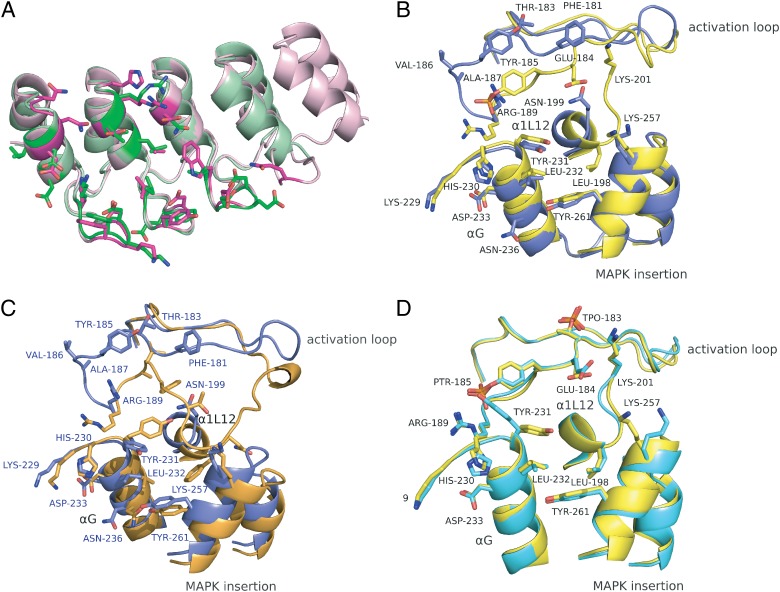
Conformational differences of the structures of complexes E40/ERK2 and pE59/pERK2. Different superpositions are shown with the interaction residues highlighted in stick mode. The color scheme is the same as in Fig. 2. Structural elements and interaction residues are labeled. (A) Superposition of ERK2-specific DARPin E40 (magenta, an N3C molecule) and pERK2-specific DARPin pE59 (green, an N2C DARPin), each in the kinase-bound state. (B) Contact regions of DARPin-bound ERK2 (blue) and pERK2 (yellow) are superposed. (C) The contact region of DARPin-bound ERK2 (blue) is superposed with unbound ERK2 (PDB ID 1ERK, orange). Interaction residues of the E40/ERK2 complex are labeled (blue). (D) Superposition of DARPin-bound pERK2 (yellow) with unbound pERK2 (PDB ID 2ERK, cyan). pThr-183 (TPO-183) is highlighted, but it is not involved in pE59/pERK2 interaction.

