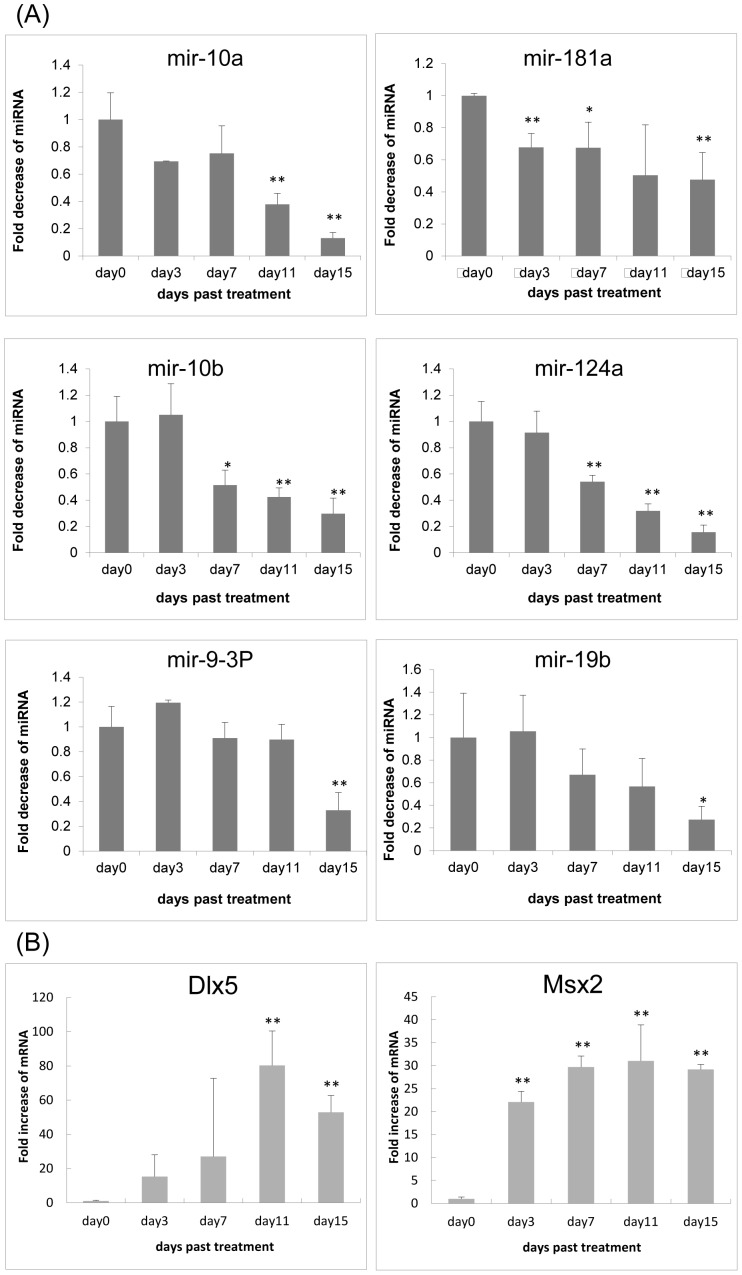
Figure 3. Expression of miRNAs targeting Dlx5 or Msx2 and levels of Dlx5 and Msx2 mRNA in quantitative RT-PCR.
(A) Time course of miR-10a, miR-10b, miR-19b, miR-9-3p, miR-124a, and miR-181a expression in differentiated iPS cells. Quantitative RT-PCR for these miRNAs was performed. Bars represent means ± SD of 3 separate wells. (B) Time course of Dlx5 and Msx2 expression in differentiated iPS cells. Quantitative RT-PCR for osteoblast markers was performed. Values represent means ± SD of 3 separate wells.

