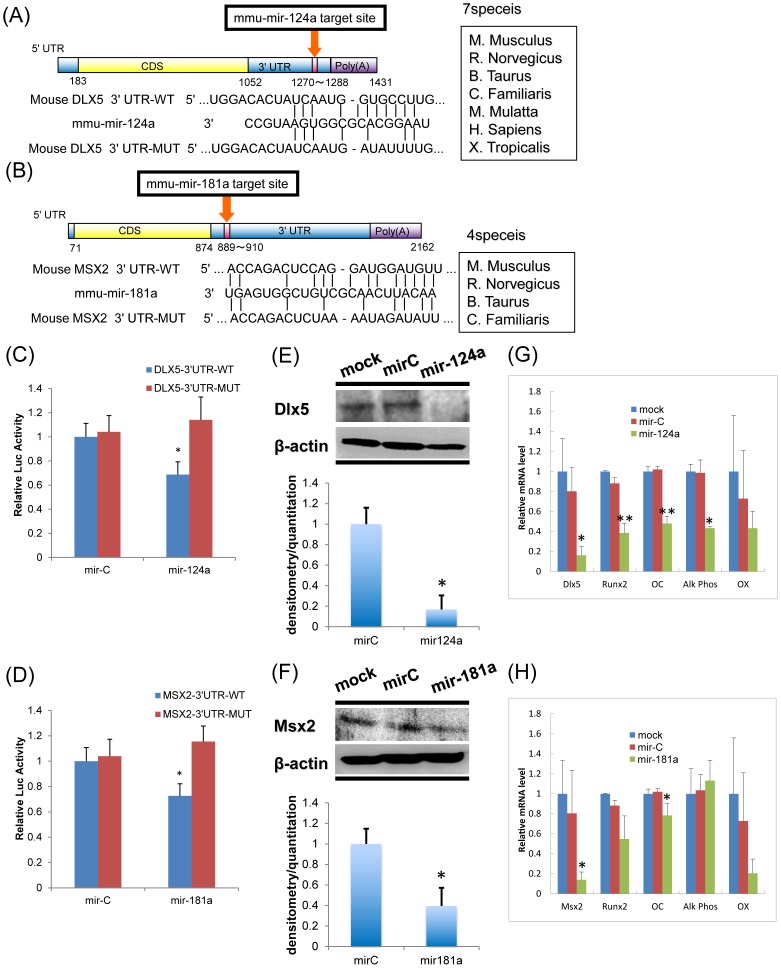
Figure 4. Functional activity of miR-124a and miR-181a on target genes.
(A) Schematic image of miR-124a putative target site in mouse Dlx5 3′-UTR and alignment of mir-124a with wild-type (WT) and mutant (MUT) 3′-UTR regions of Dlx5 showing complementary pairing. Mutated nucleotides are underlined. These seed regions are evolutionally well-conserved among higher vertebrates. (B) Schematic image of miR-181 putative target site in the mouse Msx2 mRNA 3′-UTR and alignment of miR-181a with wild-type (WT) and mutant (MUT) 3′-UTR regions of Msx2. Complementary pairing between miR-181a and Msx2 is shown. Mutated 3′-UTR nucleotides are underlined. These seed regions are evolutionally well-conserved among higher vertebrates. (C) MC3T3 cells were cotransfected with luciferase reporters carrying wild-type Dlx5 3′-UTR or mutated Dlx5 3′-UTR, phRL-null (Renilla plasmid), and 50 nM RNA oligonucleotides of mir-Control (mir-C) or miR-124a. The effects of miR-124a and control miRNAs on reporter constructs after 36 h are shown. The ratio of reporter (Firefly) to control phRL-null plasmid (Renilla) in relative luminescence units is plotted. Values represent means ± SD of 3 separate wells. (D) Functional activity of the luciferase reporter plasmid carrying wild-type or mutated Msx2 3′-UTR was assessed as described above (Fig. 4B). Values represent means ± SD of 3 separate wells. (E) miR-124a directly targets and regulates Dlx5 and inhibits osteoblastogenesis. MC3T3 osteoblast cells were transfected with miR-124a, miRNA-Control, or transfection reagent only (Mock) at the indicated concentrations. Western blots for Dlx5 and actin (as control) were performed on total cell lysates collected at 48 h. The bands of Dlx5, Msx2 and actin were detected by ImageQuant LAS4000 (GE Healthcare UK Ltd, Little Chalfont, UK), and the intensity of bands was measured by ImageJ(http://rsb.info.nih.gov/ij/). Values represent means ± SD of 3 separate wells. *P<0.05, compared to miR-C. (F) MC3T3 cells were transfected with miR-181a and miR-Control as described in (E). Values represent means ± SD of 3 separate wells. *P<0.05, compared to miR-C. (G) Quantitative mRNA levels (normalized by β-actin) by Q-PCR for Dlx5, Runx2, ALP, OC and OX after 50 nM oligo transfection. Values represent means ± SD of 3 separate wells. * and **P<0.05 and P<0.01, compared to miR-C, respectively. (H) The mRNA levels of osteoblast marker genes after transfection of miR-Control and miR-181a were determined as described in (G). Values represent means ± SD of 3 separate wells.* and **P<0.05 and P<0.01, compared to miR-C, respectively.

