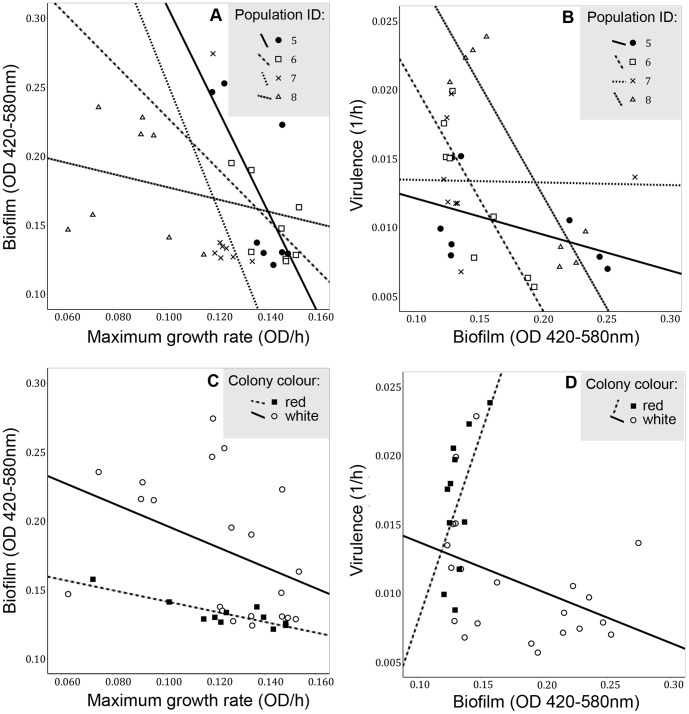
Figure 3. Bacterial life-history trait correlations within predation treatments.
Population-level (replicate selection lines numbered 5–8) correlations between (A) predation-resistant biofilm and maximum growth rate, and (B) virulence and predation-resistant biofilm. Correlations between (C) predation-resistant biofilm and maximum growth rate by colony colour, and (D) virulence and predation-resistant biofilm by colony colour.

