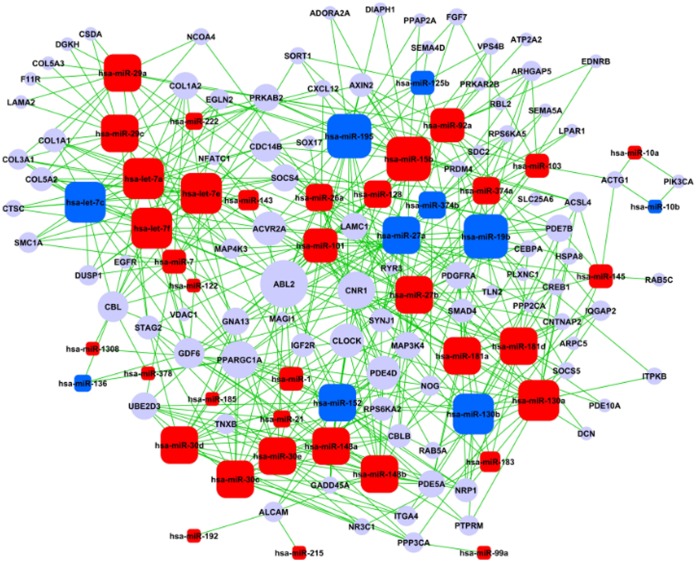
Figure 2. Regulatory network of differentially expressed miRNAs and intersection target genes associated with significant GO and pathway analyses.
Note: Rectangles with rounded corners figure represent differentially expressed miRNAs (red – increased, blue – decreased); circles represent genes; lines represent regulatory relations between differentially expressed miRNAs and genes. Size of points is related to the degree of interaction.

