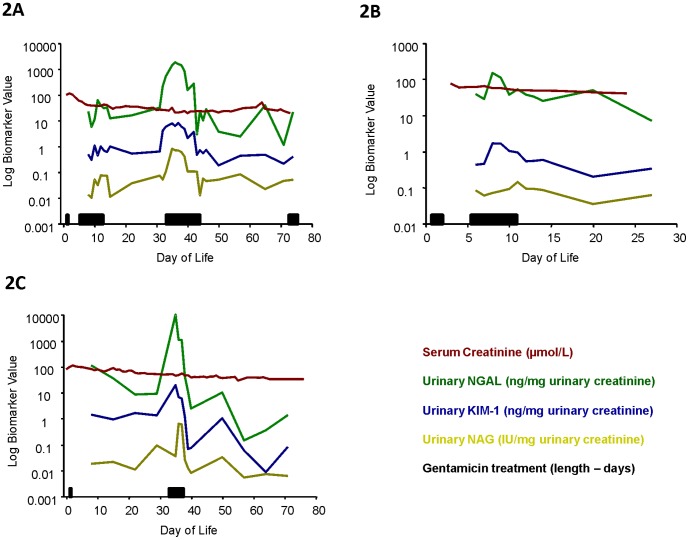
Figure 2. Longitudinal biomarker analysis of infants treated with multiple courses of gentamicin without a change in serum creatinine concentration.
Representative figures demonstrating the longitudinal quantification of the biomarkers KIM-1 (blue; ng/mg. uCr), NGAL (green; ng/mg. uCr), NAG (yellow; IU/mg. uCr) and serum creatinine (red; µmol/L) for three infants treated with gentamicin (A–C). Gentamicin treatment episode and length of treatment (days) are indicated by the black horizontal bar on each figure for that individual patient.

