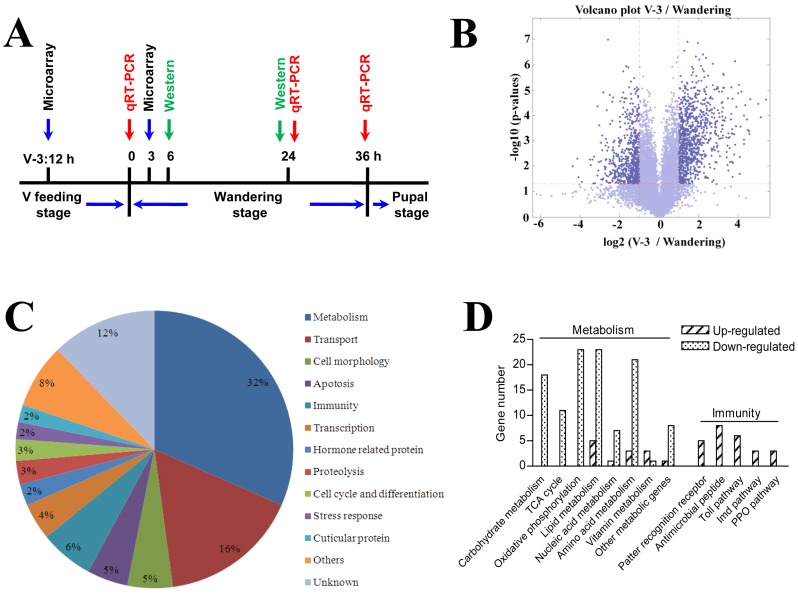
Figure 2. General statistics on the genes regulated between the feeding stage (V-3:12 h) and wandering stage (W:3 h).
(A) The times of different sampling. We selected larvae at 12 h on day 3 of the fifth larval stage (V-3:12 h), or 3 h after the initiation of the wandering stage (W: 3 h), which were dissected for the microarray. The time points for Western blot and qRT-PCR were determined according to the preliminary work with lysozyme. (B) Volcano plots depicting estimated fold change (log2, X-axis) and statistical significance (−log10 P value, Y-axis). Each point represents a gene, and colors correspond to the range of negative log10 P and log2 fold-change values. (C) GO categories of differentially transcribed genes between the feeding and wandering stages. (D) The numbers of up- and down-regulated genes associated with various metabolic events and innate immunity.

