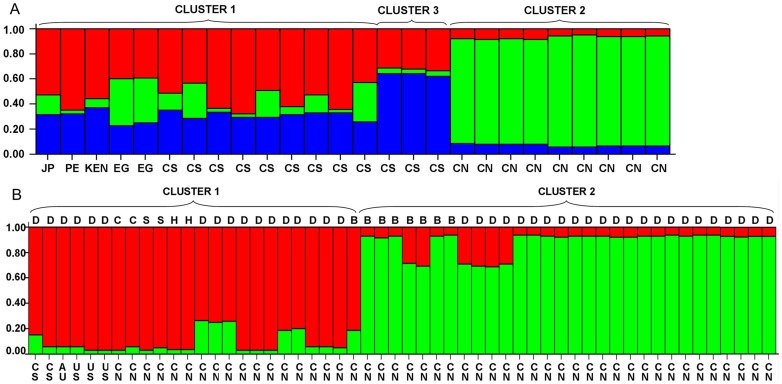
Figure 2. Population structure inferred by Bayesian clustering using multilocus subtype information.
A, Cryptosporidium muris; B, Cryptosporidium andersoni. Each individual is shown as a thin vertical line, which is partitioned into K colored components representing estimated membership fractions in K genetic clusters, and the geographic locations are at the bottom. The pie charts show the distribution of genetic clusters in different countries and various animals. JP = Japan; PE = Peru; Ken = Kenya; EG = Egypt; CS = Czech Republic; CN = China; B = beef cattle; C = bactrian camel; D = dairy cattle; H = hamster; S = sheep.

