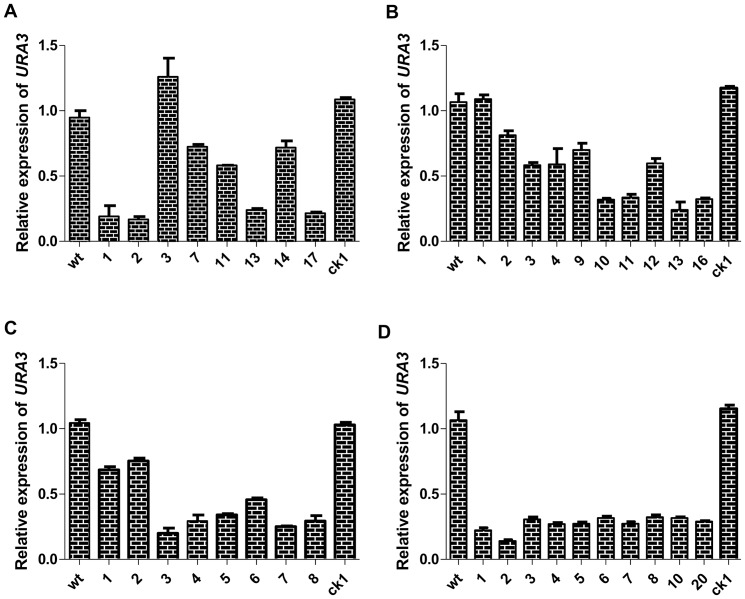
Figure 5. Measurement of URA3 gene expression as determined by real-time PCR.
Real-time PCR analysis was performed on pAN7-ura3-hp (A), pAN7-ura3-s (B), pAN7-ura3-as (C) and pAN7-ura3-dual (D) transformants. The relative mRNA levels of URA3 were calculated as the ratio of G. lucidum URA3 mRNA to endogenous 18S rRNA. The upper running title of each panel is the ratio of URA3 mRNA and 18S rRNA mRNA compared with wt. The lower running title of each panel is the silenced transformant, wt and ck1 strains. Wild type was considered to have a value of 1.0 for all experiments trials because the mRNA expression in all other isolates was relative to wt. Values are the means ± SE (n = 3).

