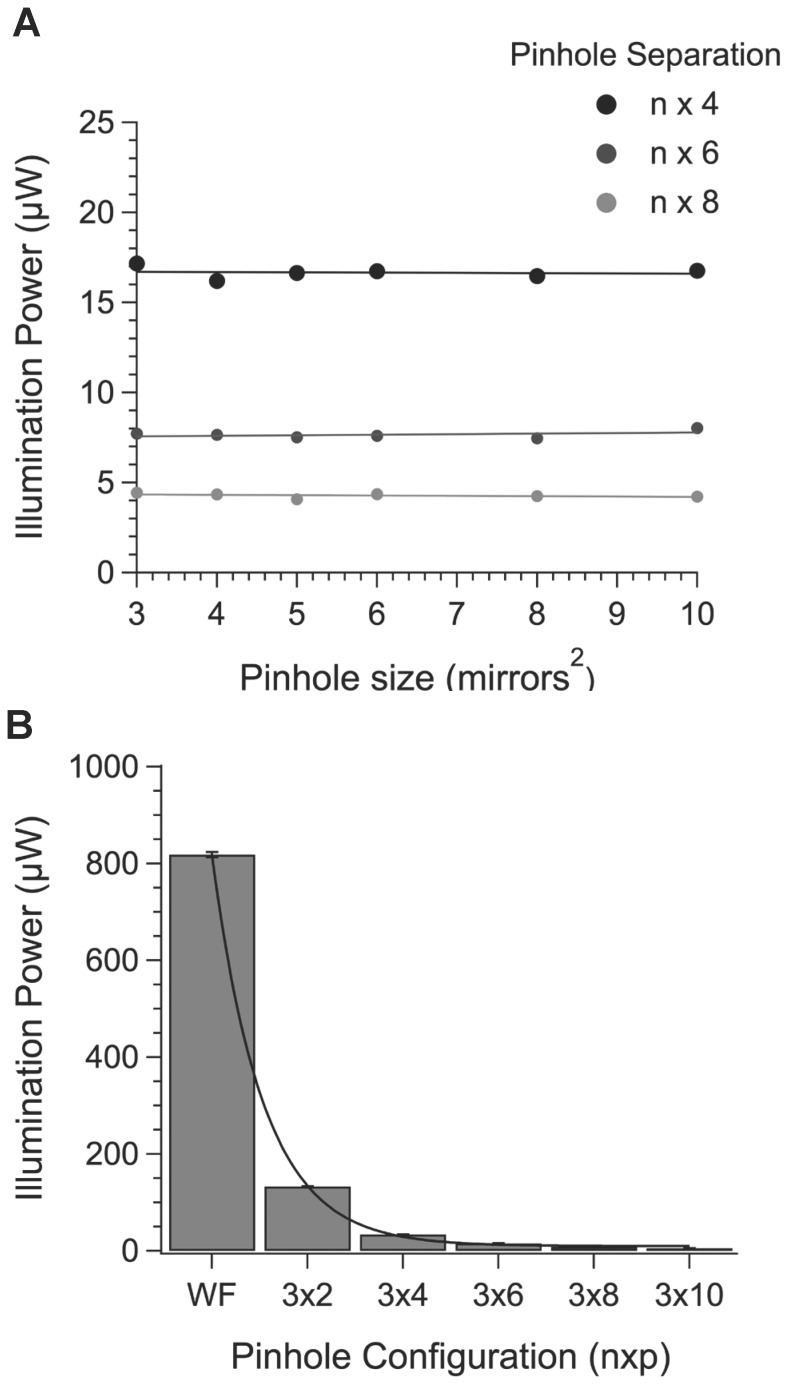
Figure 4. The relationship between pinhole size and separation on output power measured at the specimen.
A. The average power at the specimen plane was measured for each pinhole configuration. Separations of 4, 6 and 8 pinhole widths are shown. B. The average power measured at the specimen plane for a 32 pinhole at different separations is shown. Superimposed is an exponential fit of the data.

