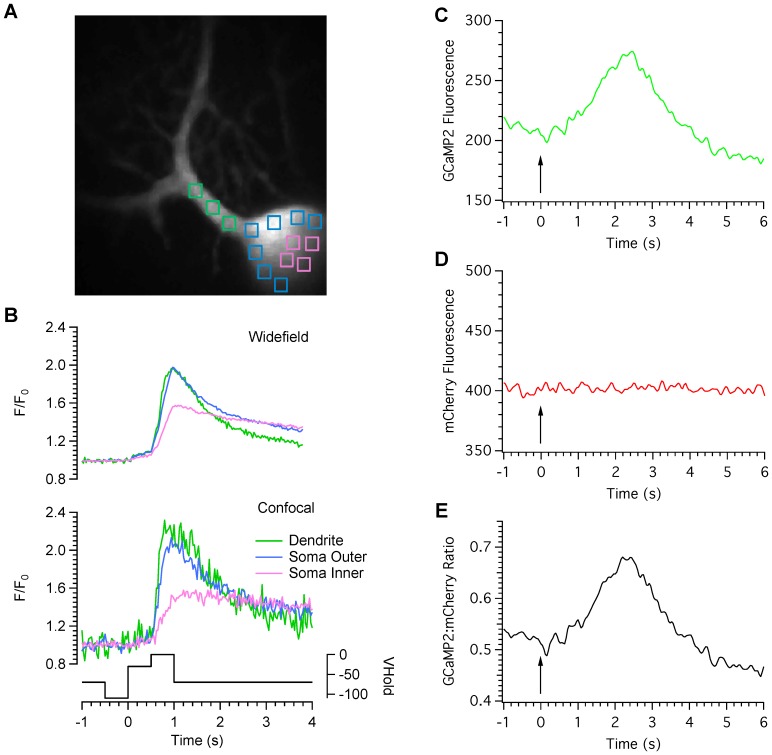
Figure 6. High-speed calcium imaging.
A Purkinje cell was filled with the high affinity calcium indicator Oregon green BAPTA-1 and voltage clamped at −70 mV. Regions of interest were position over somatic and dendritic regions as shown in panel A. The cell was then pre-hyperpolarised to −110 mV, stepped to −40 mV and then to 0 mV to activate low- and high-voltage activated calcium channels respectively. Images were collected at 30 frames per second in wide-field (upper traces) and confocal (lower traces) modes. Note the differences in peak amplitude and time course for wide-field and confocal modes for each cellular compartment. The holding potential of the cell is shown under the calcium trace. C. Fluorescence measurements were taken from a hippocampal neurone transfected with a ratiometric, genetically encoded calcium indicator named GCaMP2-mCherry. Graphs C–E represent measurements of the GCaMP2, mCherry and ratio signals respectively. 180 pairs of images were collected at 40 ms intervals. The arrows indicate the onset of stimulation with 50 pulses at a rate of 20 Hz.

