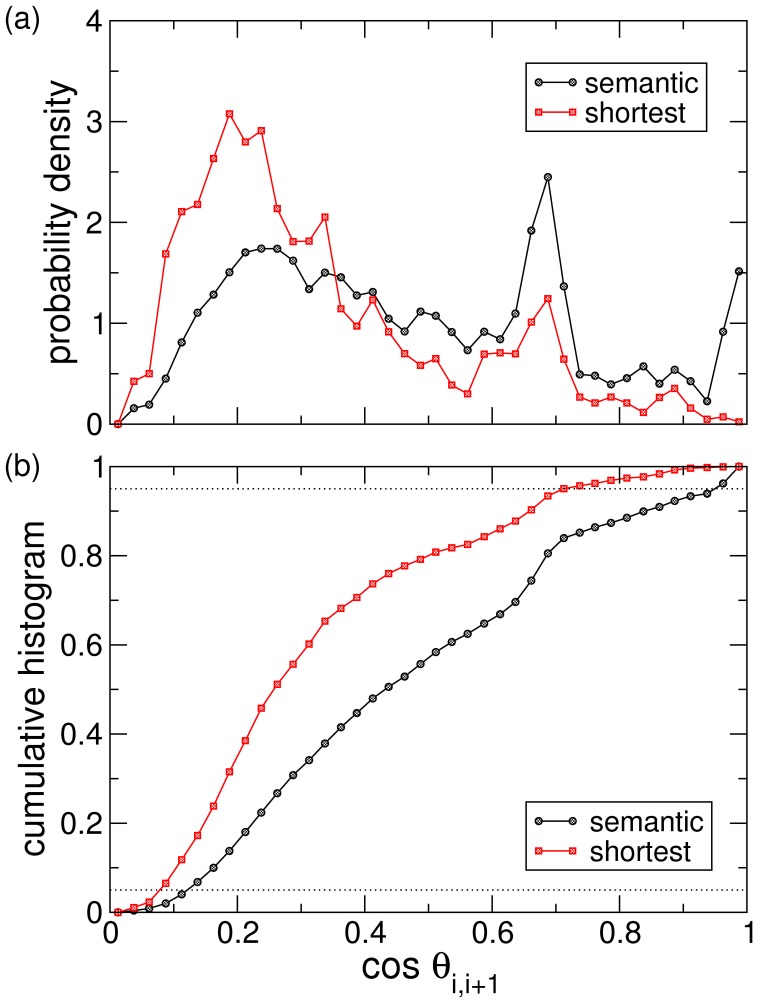
Figure 6. (a) Probability density of similarities between consecutive nodes along all semantic (black circles) and shortest paths (red squares).
Semantic paths exhibit a peak around  , whereas the mode of the distribution for shortest paths is peaked around
  . This fact shows that similarity between consecutive jumps from source to target along semantic paths is smooth, whereas similarity can change abruptly along shortest paths. (b) Cumulative probability of similarities between consecutive nodes. Note that the distribution for semantic paths lays below the shortest paths’ one. Dotted lines mark the
  and
and  probability levels.

