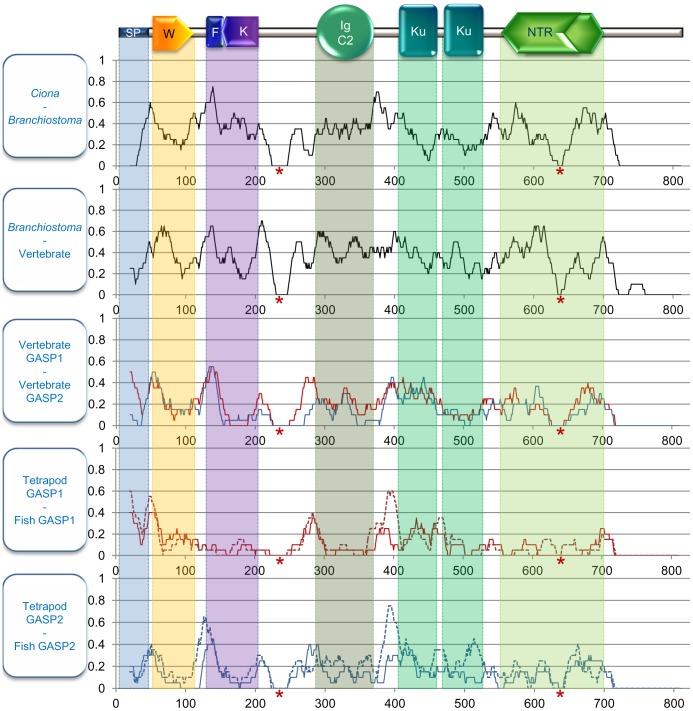
Figure 4. Substitution rate of GASP proteins in the different branches of the evolutionary tree.
For each site the substitution rate was calculated from a moving average using a window size of 20 amino acids. The site position from start methionine is on the abscissa and the mean substitution rate on the ordinate. The black curves correspond to the ancestor of GASP1 and GASP2 proteins. The red and blue curves correspond to GASP1 and GASP2 respectively. Red asterisks represent gaps in sequence alignment due to one or two species. In the last two parts, the dotted lines correspond to fish and the solid lines to tetrapods. Abbreviations: SP: signal peptide, W: WAP, F: follistatin, K: kazal, Ku: kunitz, NTR: netrin domains.

