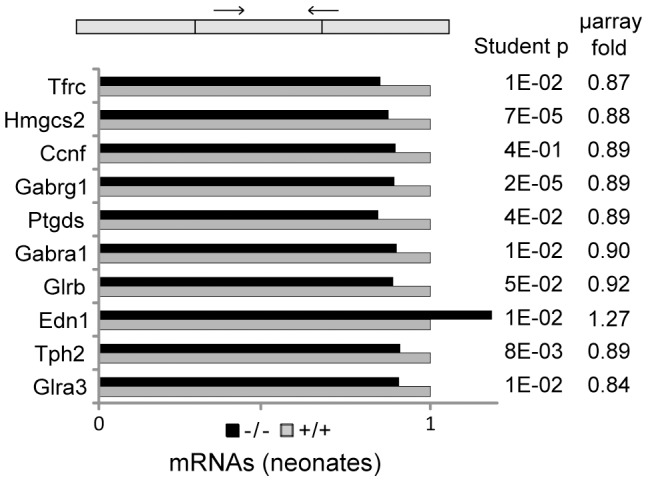
Figure 6. Q-PCR analyses of mRNAs in brain of wildtype and KIS-ko neonate mice.

Pairs of primers for mRNAs were chosen so that the PCR product crossed an exon-exon boundary. The mean values of mRNA levels relative to wildtype for 16 −/− and 16 wildtype littermates are presented. Paired student t-test values for the qRT-PCR data are indicated as well as the fold changes that were deduced from the microarrays analysis for comparison.
