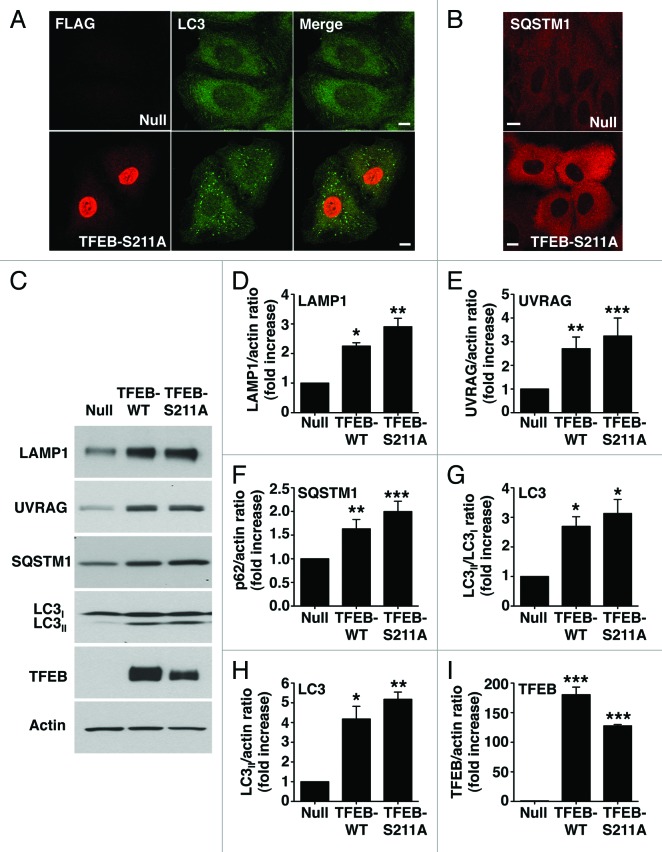
Figure 5. TFEB-S211A induces accumulation of autophagosomes. Immunofluorescence confocal microscopy showing autophagosome accumulation (A) and increased cytosolic SQSTM1 (B) in ARPE-19 cells overexpressing TFEB-S211A. (C) Immunoblotting of ARPE-19 cell lysates infected with either adenovirus Null or adenovirus expressing TFEB-wt or TFEB-S211A. Protein bands were detected using the indicated antibodies. (D–I) Quantification of protein bands as shown in (C). Bars represent the ratio of LAMP1/actin (D), UVRAG/actin (E), SQSTM1/actin (F), LC3II/LC3I (G), LC3II/actin (H), and TFEB-Flag/actin (I) expressed as fold increase of the ratio from cells infected with adenovirus Null. Values are means ± SD of three independent experiments. Scale bar: 10 μm. ***p < 0.001, **p < 0.01, *p < 0.05.

An official website of the United States government
Here's how you know
Official websites use .gov
A
.gov website belongs to an official
government organization in the United States.
Secure .gov websites use HTTPS
A lock (
) or https:// means you've safely
connected to the .gov website. Share sensitive
information only on official, secure websites.
