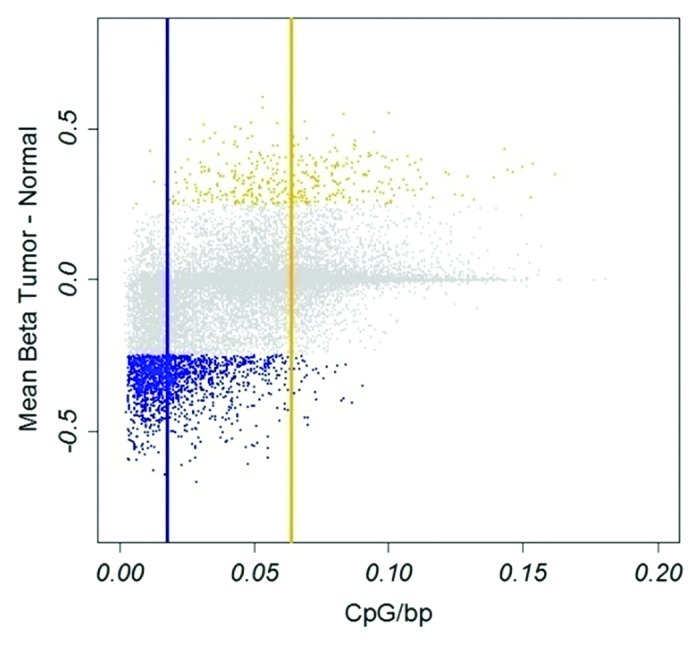
Figure 1. Hypo- and hypermethylated CpGs in tumors. Hypomethylation, blue; hypermethylation, yellow. Vertical blue and yellow lines indicate median CpG density of hypo- and hypermethylated CpGs, respectively. X-axis, CpG density defined as fraction of CpGs in a 1600 bp window. Y-axis, difference in β-value between tumor and normal tissue.
