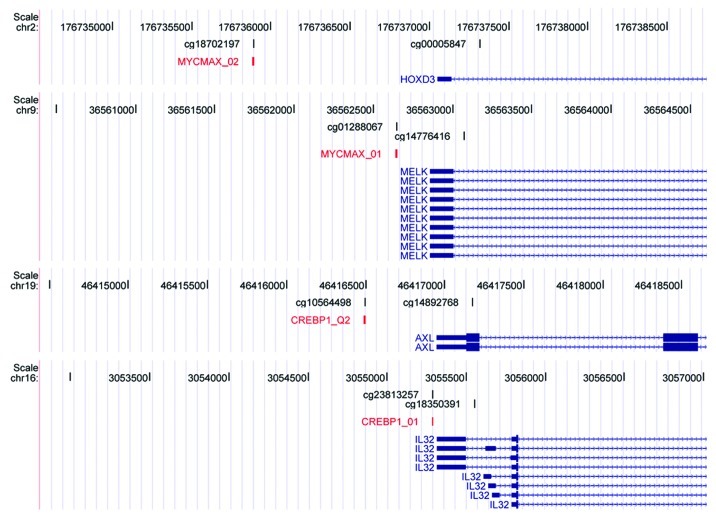
Figure 2. Transcription factor binding motifs contain CpGs that show a positive association between methylation and gene expression levels. UCSC genome browser view of MYCMAX_01/02 and CREBP1_01/Q2 transcription factor motifs. Each panel contains the following tracks from top to bottom: Coordinates of human hg18 genome. CpGs present on Illumina’s 27K platform. Transcription factor motifs, red. RefSeq genes, blue.

An official website of the United States government
Here's how you know
Official websites use .gov
A
.gov website belongs to an official
government organization in the United States.
Secure .gov websites use HTTPS
A lock (
) or https:// means you've safely
connected to the .gov website. Share sensitive
information only on official, secure websites.
