
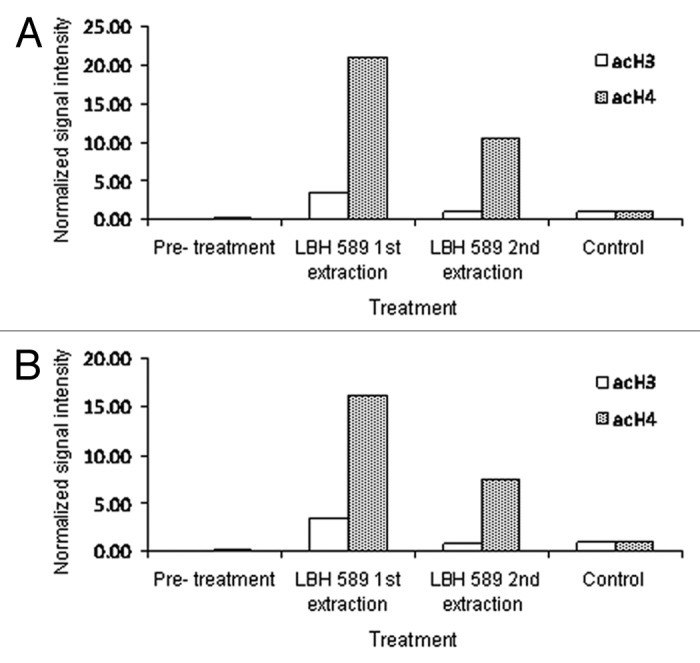
Figure 2. Quantitative analysis of acetylation from western blotting. Bands representing acetylated histone were adjusted for β-actin intensity and normalized to those of the positive control, LBH589-treated 697 leukemia cells. Data are shown for anti-acetylated histone H3 and H4 on cells extracted by (A) Ficoll-Paque PLUS and (B) red cell lysis. Day 0 indicates the pre-treatment sample. Lanes labeled as 1st extraction represent post-incubation leukocytes treated with 100 nM LBH589 for 24 h and 2nd extraction represent leukocytes treated with LBH589 for 24 h and then re-separated from leukocyte depleted blood