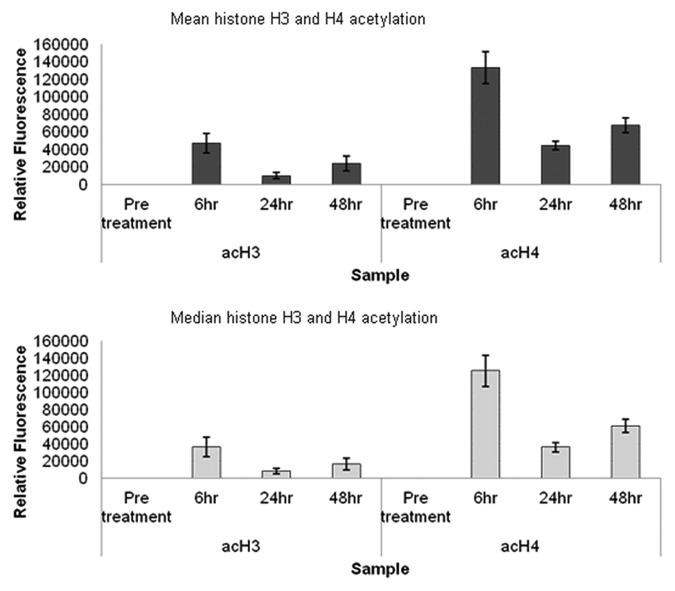
Figure 6. Analysis of in vivo leukocyte histone acetylation by flow cytometry. Mean and median fluorescence values for histone H3 and histone H4 acetylation in four sets of leukocytes over a treatment course, obtained by flow cytometry. The standard error of the statistical mean is indicated by the error bars. The y-axis shows the relative fluorescence intensity. Pre-treatment patient data were histogram subtracted from that of cells collected 6, 24 and 48 h post a single 30 min infusion of 15 mg/m2 LBH589. Cells were fixed post-separation from blood by red cell lysis. The fixed cells were stained for histone H3 and histone H4 acetylation and analyzed by flow cytometry

An official website of the United States government
Here's how you know
Official websites use .gov
A
.gov website belongs to an official
government organization in the United States.
Secure .gov websites use HTTPS
A lock (
) or https:// means you've safely
connected to the .gov website. Share sensitive
information only on official, secure websites.
