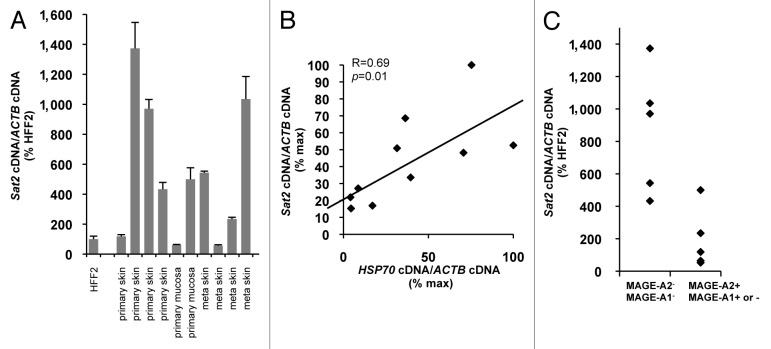
Figure 4.Sat2 RNA levels are correlated with HSP70 expression in melanoma tissues. (A) Relative Sat2 RNA levels measured in 6 primary melanoma tumors and 4 melanoma metastases. Data are presented as % ± SEM of the expression measured in HFF2. (B) Comparison between Sat2 and HSP70 expression levels in melanoma tissues from A. Both Sat2 and HSP70 cDNA levels were normalized to ACTB cDNA and expressed as % of the maximal value measured in the samples. (C) Melanoma tissues from A were classified into two groups according to the presence (+) or the absence (-) of MAGE-A2 or MAGE-A1 transcripts. Relative Sat2 RNA levels, as described in A, are indicated.

An official website of the United States government
Here's how you know
Official websites use .gov
A
.gov website belongs to an official
government organization in the United States.
Secure .gov websites use HTTPS
A lock (
) or https:// means you've safely
connected to the .gov website. Share sensitive
information only on official, secure websites.
