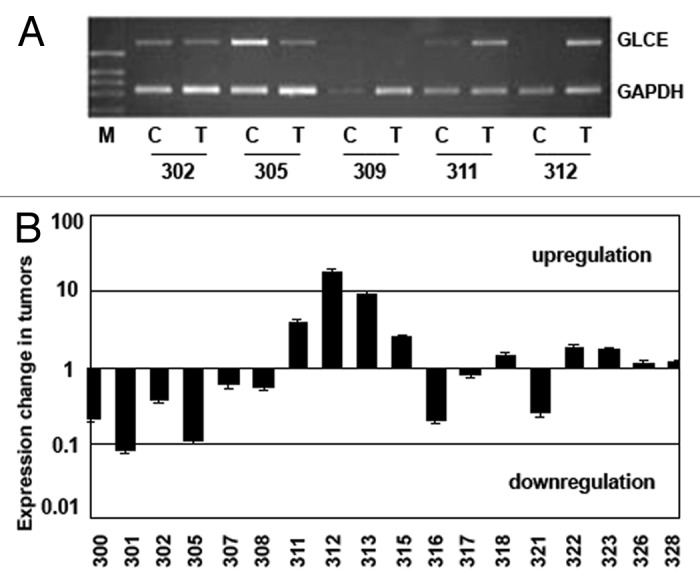
Figure 1.GLCE expression in the human breast tumors. (A) Representative RT-PCR electropherogram, (B) GLCE expression in tumor samples T, related to the match control breast tissue samples C, 1 – similar expression in both samples, upper and down – upregulation or downregulation of GLCE expression, respectively, 301–328 - patients.
