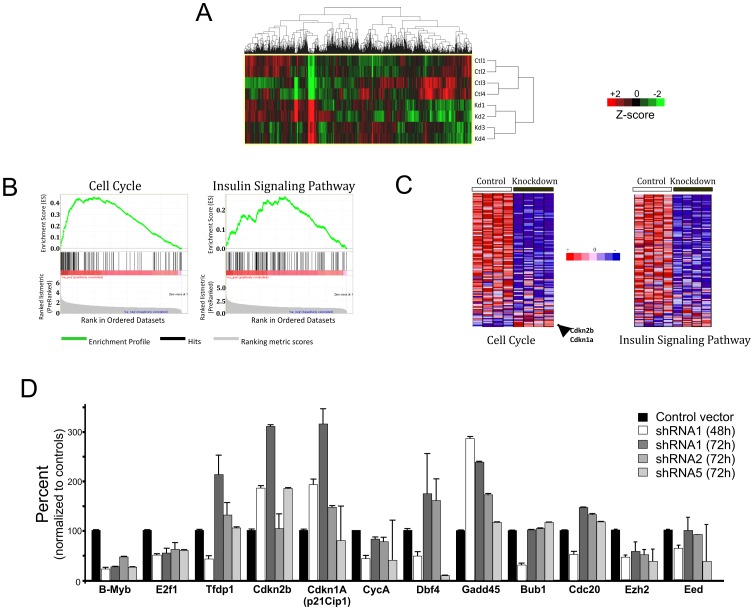
Figure 3. Pathway enrichment analysis.
A) Hierarchical clustering of differentially expressed genes (fold-change ≥1.5) in control and B-MYB deficient cells. Red and green colors denote increased and decreased expression, respectively. Each row represents a unique experiment (n = 4, ctl and n = 4, KD) B) KEGG pathway enrichment among the B-MYB knockdown-repressed genes. The enrichment profiles for cell cycle and insulin signaling pathways for genes with reduced expression in B-MYB deficient cells are shown. C) Heatmaps showing gene expression in cell cycle and insulin signaling pathways, indicating that the majority of transcripts are decreased (blue) in abundance in the absence of B-MYB. D) Confirmation of shRNA1 specificity and qPCR analysis of selected cell cycle products and epigenetic regulators. Most of the transcripts analyzed by qPCR showed consistent trends in expression after nucleofection with shRNA1, shRNA2 or shRNA5. Exceptions included Cip1 and Dbf4, both of which had unexpectedly low transcript levels with shRNA5 relative to shRNAs 1 and 2. Almost all of the transcripts with decreased expression 48 hours after nucleofection had modest to significant increases in mRNA expression 24 hours later.

