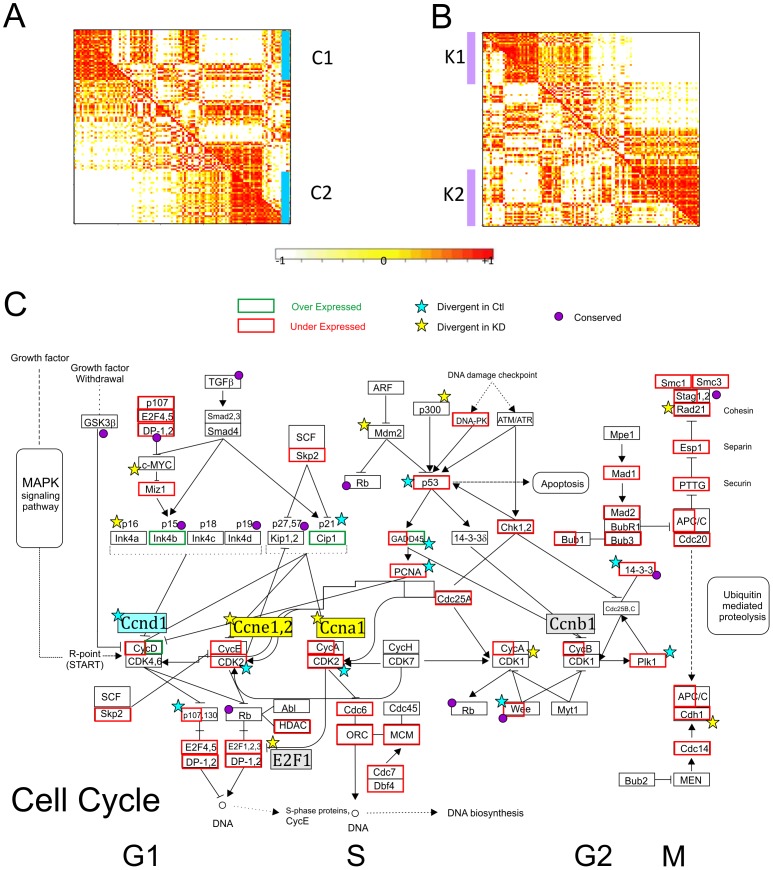
Figure 4. Identification of conserved and divergent co-expression gene clusters in the cell cycle.
A) Graphic representation of a correlation matrix of genes based on expression profiles in control (the lower-left triangle) and B-MYB knockdown (the upper-right triangle) ESCs. Genes are listed on the horizontal and vertical axes in the same order. Clustering profiles were determined from the correlation of gene expression where control samples were used as the primary reference. C1 and C2 represent co-expression clusters in controls. The light-to-dense color gradient on the graph indicates low-to-high correlations between gene and their expression. B) Clustering analysis based on the correlation of gene expression where B-MYB deficient (knockdown) samples were employed as the primary reference. K1 and K2 represent co-expression clusters in knockdown conditions. C) Core network illustrating expression and co-expression patterns in a KEGG cell cycle pathway.

