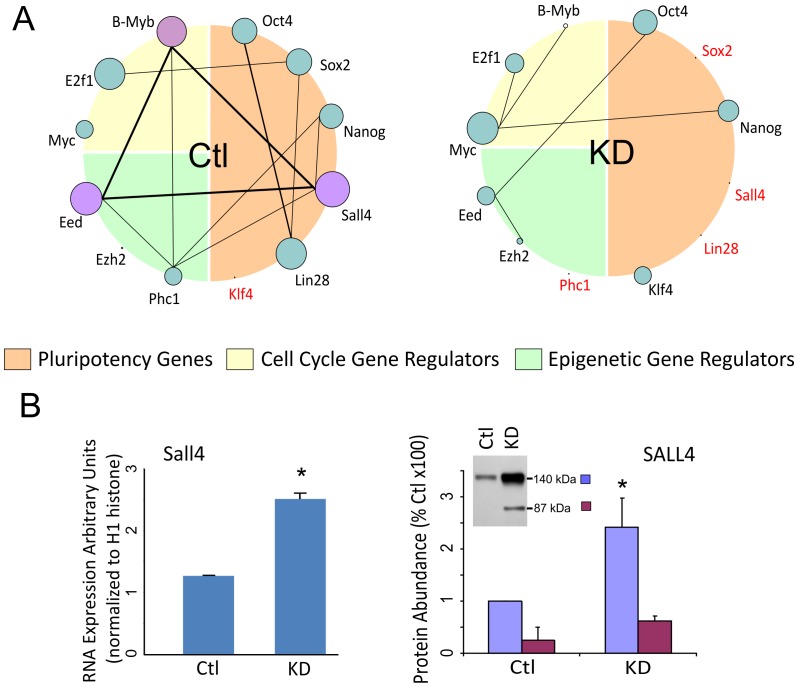
Figure 5. Global network analysis showing the distribution of connections per node in the co-expression networks.
A) Interactome showing hub genes and connectivities among hubs of selected pluripotency, cell cycle and epigenetic regulator-associated genes in control (Ctl) and B-Myb knockdown (KD) cells. The size of each circle is directly proportional to the number of links (connectivity) for the indicated hub gene, and lines between genes are indicative of the number of overlapping links. As shown in this figure, B-Myb, Eed and Sall4 are major hub genes in control cells that have overlapping links with over 160 genes. Following knockdown of B-MYB, all of major hub genes either become minor hubs or lose all connectivity (shown in red). B) Based on the analysis, Sall4, a transcription factor found to be central to the control ESC network, loses all connectivity in B-MYB deficient ESCs (4A); but in response to the loss of B-MYB, Sall4 transcript and protein abundance increase significantly, suggesting that the up-regulation of this gene is a compensatory response to the loss of B-MYB.

