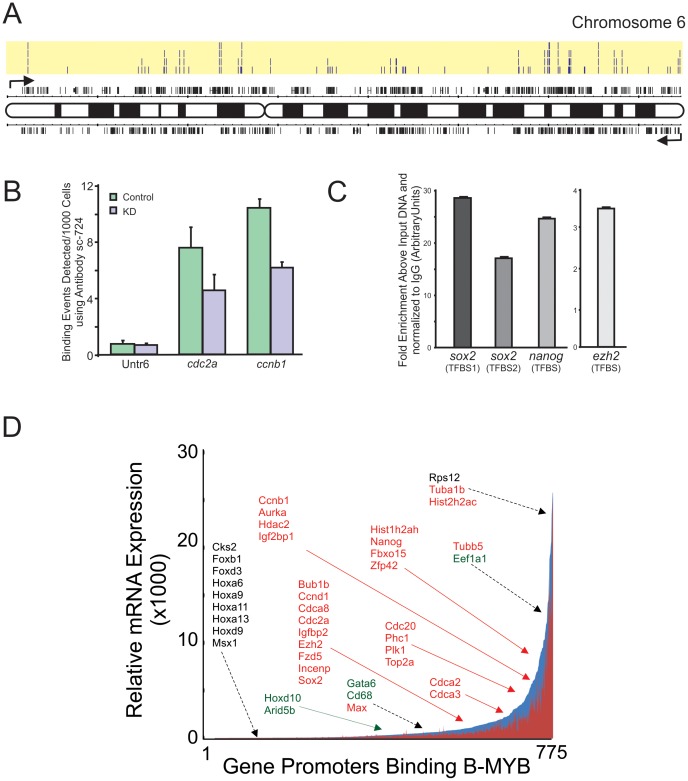
Figure 6. Identification of B-MYB binding sites on gene promoters and corresponding gene expression profiles.
A) ChIP-chip analysis showing the locations and number of B-MYB binding sites (highlighted in yellow shading, n = 4 biological replicas) and corresponding genes on Chromosome 6 (for details, see Table S6). Binding was determined from promoter regions corresponding to 8 kb upstream and 2 kb downstream of the 25,500 transcription start sites of the whole mouse genome. B) To determine antibody specificity, ChIP assays of known B-MYB target genes were performed in ESCs after B-MYB knockdown. Relative to controls, the number of binding events on known target genes cdc2a and ccnb1 was significantly reduced in B-MYB deficient cells (KD), indicating that the antibody had good specificity for B-MYB. Untr6 – Untranscribed control DNA sequence. See Methods for experimental details. C) Independent ChIP assays using IgG precipitated chromatin as a control confirming binding of B-MYB to the promoter regions identified by ChIP-chip for sox2 (two sites), nanog and ezh2. D) Plot of B-MYB target genes (Table S6) with corresponding microarray expression data taken from Table S1. This plot indicates that B-MYB target genes have expression levels ranging from just detectable to elevated.

