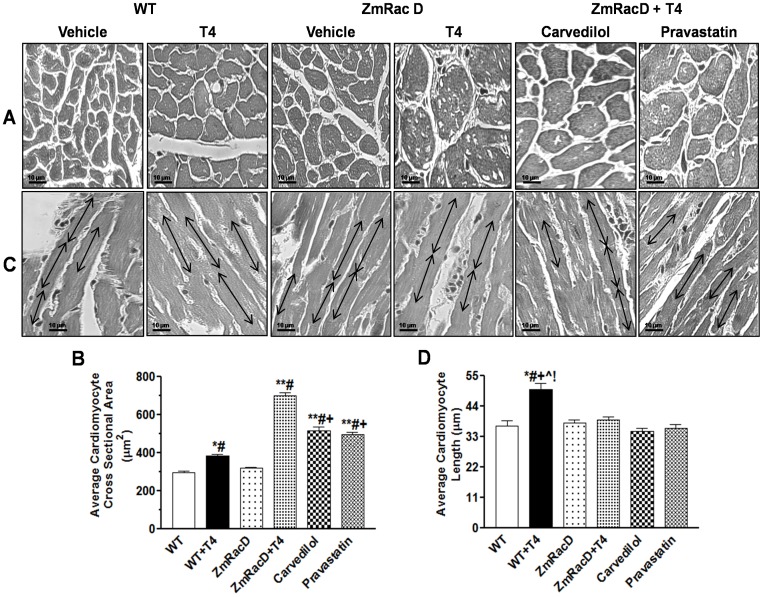
Figure 2. Structural Remodeling of Cardiac Myocytes in the Hearts of T4-Treated Mice.
Masson's trichrome staining images with representative bar graphs for average cardiac myocytes cross sectional areas (A & B). Masson's trichrome staining images with representative bar graphs for average cardiac myocytes lengths (C & D); Magnifications are the same for all panels (size bar, 10 µm). * is significant change compared to untreated WT mice, ** is significant change compared to T4-treated and untreated WT mice, # is significant change compared to untreated transgenic mice, + is significant change compared to T4-treated transgenic mice, ∧, ! are significant change compared to T4-supplemented transgenic mice that pre-treated with carvedilol and pravastatin, respectively, (n = 8/group).

