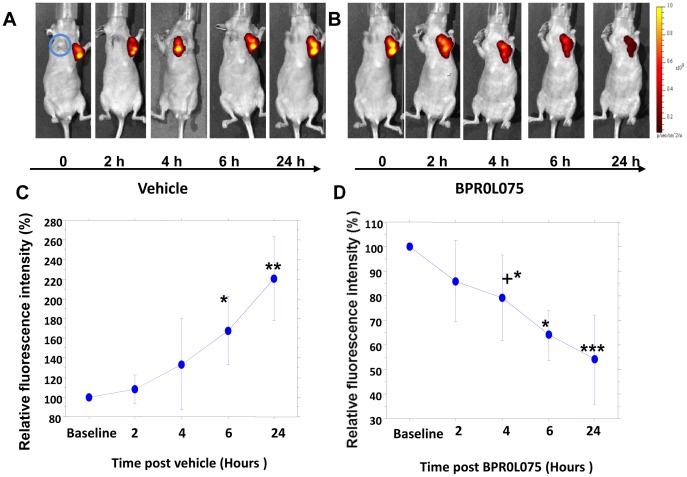
Figure 1. Fluorescence images of mammary breast tumor response to administration of BPR0L075 at successive time points.
Sequential images of a single nude mouse with orthotopic MCF7-lacZ and MCF7-luc-GFP-mCherry breast tumors growing in the front right (blue circle) and left mammary fat pad, respectively. Fluorescent signal (mCherry) increased over 24 hours following administration of carrier vehicle (A), but signals diminished 4, 6, and 24 hours after injection of BPR0L075 (B); (C) Variation in normalized fluorescent signal intensity for the group of three MCF7-luc-GFP-mCherry tumors in response to vehicle injection; (D) Variation in normalized fluorescent signal intensity for the group of six MCF7-luc-GFP-mCherry tumors in response to injection of BPR0L075. * P<0.05, ** P<0.01, *** P<0.0001; + only three tumors observed at this time point.

