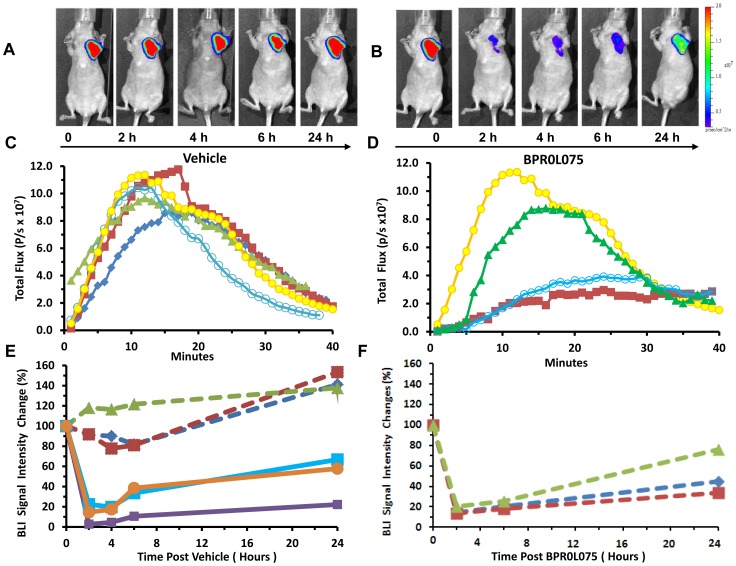
Figure 2. MCF7-luc-GFP-mCherry breast tumor response to administration of BPR0L075 observed by bioluminescence.
(A, B) BLI of the same mouse as shown in Figure 1 with images obtained within 15 mins after administration of luciferin s.c. immediately after the FLI; (C) Dynamic BLI showing evolution of signal intensity for the MCF7-luc-GFP-mCherry tumor shown in “A” over 40 minutes; respective curves show baseline (blue diamonds), together with 2 (red squares), 4 (green triangles), 6 (open circles) and 24 (yellow circles) hours after administration of drug carrier vehicle; (D) Dynamic BLI with respect to treatment with BPR0L075 (50 mg/kg i.p.): baseline (same as 24 hour time point in “A”, yellow circles); 2 hours after drug (red squares), 6 hours after drug (open circles) and 24 hours after drug (green triangles); (E) Normalized maximum bioluminescent signal observed in the first 15 mins post luciferin injection at each time point sequentially for individual mice over 24 hours with respect to carrier vehicle (n = 3, dashed lines) or drug (n = 3; solid lines). Control mice show highly reproducible signal, though with significant increase after 24 hours, whereas treated mice show severely decreased signal at the 2 hour time point, though with progressive recovery over 24 hours; (F) The control mice in “E” (dashed lines same symbol designation) were treated with drug on the second day and maximum light emission is plotted. These data were renormalized to the 24 hour time point in “E”. Data look very similar to the mice receiving drug in “E”.

