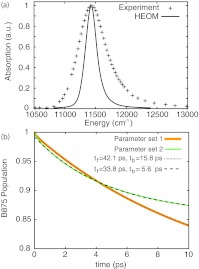
Figure 5.
(a) LH1 absorption spectrum. Shown is a comparison of spectra from Ref. 66 and calculated here using the HEOM approach, but excluding static disorder. (b) Excitation transfer from LH1 to RC. Excitation transfer was determined both for parameter sets 1 and 2. Shown are close comparisons between the HEOM results and descriptions in terms of the kinetic model in Eq. 10 where tf is the LH1→RC transfer time and tb is the RC→LH1 transfer time.

