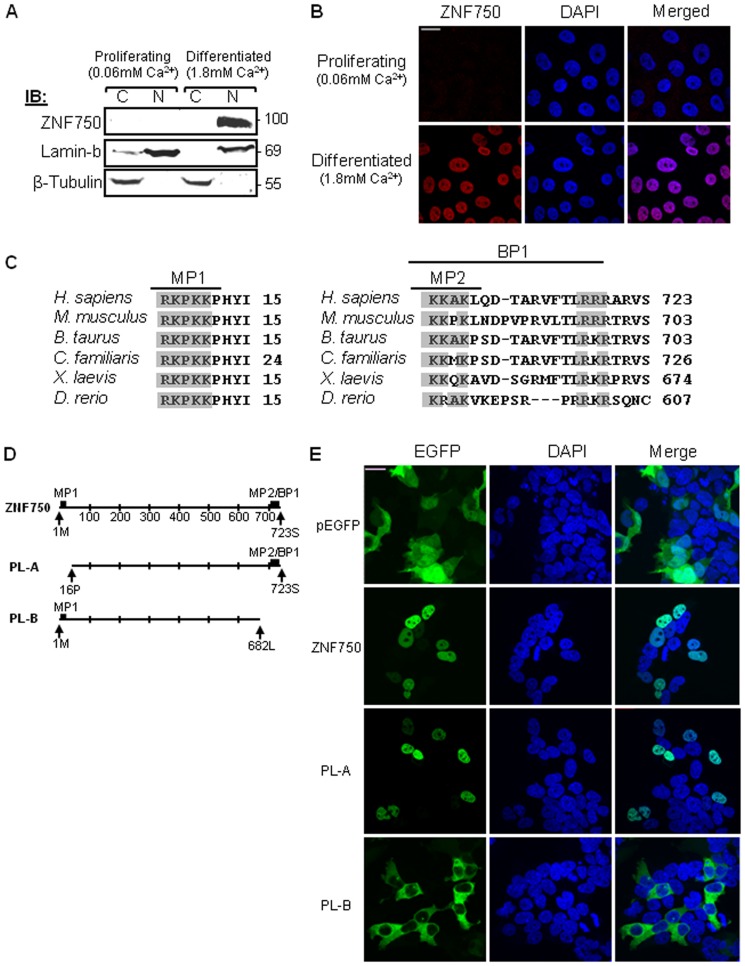
Figure 1. ZNF750 subcellular localization and functional NLS characterization.
(A) Western blot analysis using cytoplasmic (C) and nuclear (N) fractions from HaCaT cells at proliferative/undifferentiated (0.06 mM Ca2+) or differentiated (1.8 mM Ca2+) state, analyzed by anti-ZNF750 Ab. (B) Confocal subcellular localization of ZNF750 in HaCaT cells. Cells at proliferative and differentiated states were fixed and immunostained by anti-ZNF750 Ab (red). DAPI (blue) was used to identify nuclei. Scale bar = 20 µm. (C) Sequence alignments representing the three putative NLSs of ZNF750 homologues in various organisms. Conserved amino acids of the predicted NLSs are shaded. (D) Schematic representation of EGFP-ZNF750 constructs. (E) Confocal subcellular localization of ZNF750 constructs in HEK293 cells. The expression of pEGFP-C2 (EGFP alone) is shown as a control. EGFP (green); DAPI (blue) was used to identify nuclei. Scale bar = 20 µm.

