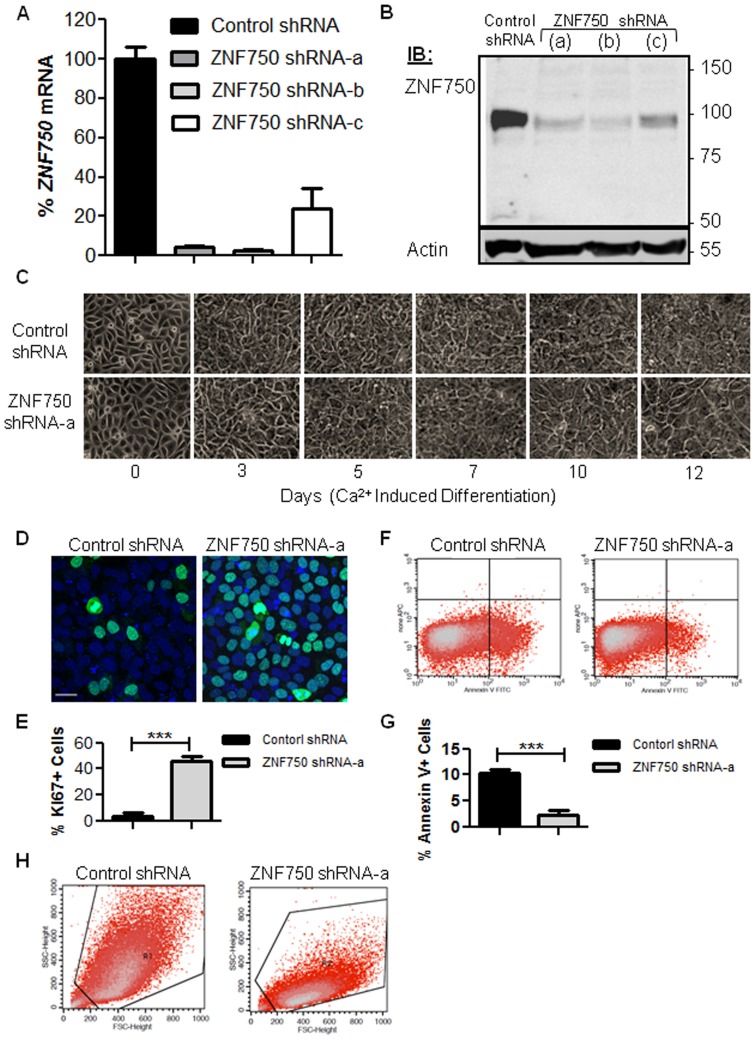
Figure 3. ZNF750 silencing in HaCaT keratinocytes.
HaCaT cells were transduced with scrambled shRNA (control) or with three different ZNF750 shRNAs (shRNA-a, b, and c). Cells were harvested and assayed at day 12 of Ca2+ induction. (A) QRT-PCR of ZNF750 mRNA expression in the stable transduced cell lines. Error bars represent mean values±SD, N = 3. (B) western blot analysis showing ZNF750 protein levels in the stable transduced cell lines. A total of 50 µg of protein was loaded in each sample. Actin levels were measured to ensure equal amounts of loaded protein were loaded. (C) Morphological studies at different time points in HaCaT cell differentiation: control vs. ZNF750 shRNA-a transduced cultures examined by phase contrast microscopy during Ca2+ induction. (D,E) ZNF750 downregulation enhances cell proliferation. (D) Ki67 staining (green) followed by confocal microscopy. To-Pro 3 nuclear staining is shown in blue (E) quantification of Ki67 positive cells. More than 800 cells were counted for each slide, Error bars represent mean values±SD, N = 6 (***:P<0.0001). (F,G) Effects of ZNF750 downregulation on apoptosis as assessed by Annexin V apoptosis assay. (F) Annexin V apoptosis assay using flow cytometry analysis. (G) quantification of Annexin V positive cells. More than 50,000 cells were counted in each sample Error bars represent mean values±SD, N = 4, (***:P<0.0001). (H) Effects on cell size (X axis) and granularity (Y axis) measured by flow cytometry.

