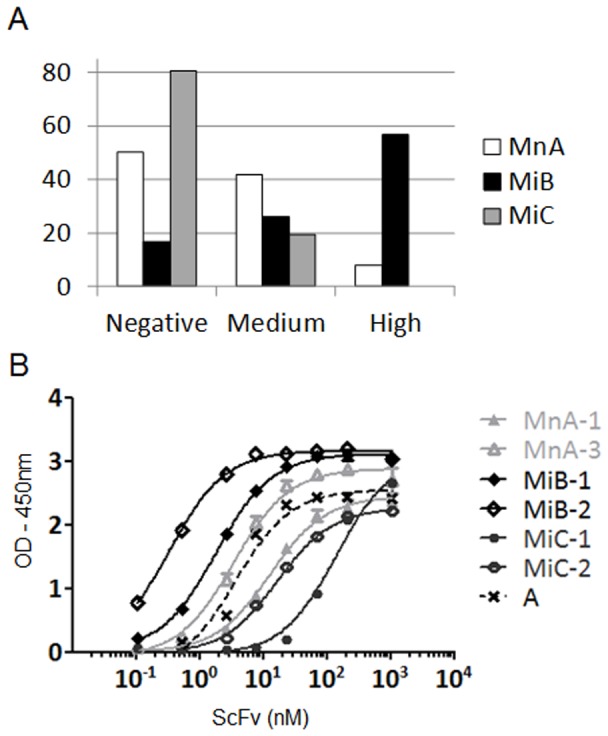
Figure 3. Screening of selections outputs from biased and naive murine libraries.

(A) The supernatants of random clones from the selection round 3 against hIFNγ were tested independently in scFv ELISA against the same antigen (88 clones tested for each library). Clones were then ranked according to their level of absorbance at 450 nm. Were defined “high”, clones with absorbance values above 70% of the signal of a positive control scFv (absorbance ∼2.1), “medium”, clones between 10% and 70% (absorbance 0.3 and 2.1) and “negative”, clones below 10%. Histograms show the percentage of clones relative to their corresponding level of absorbance. (B) The two most frequent clones according to NGS were purified as scFv and tested in parallel in a dose response ELISA against hIFNγ (n = 2). Sequences from these clones are given in Table 2. The graph shows the level of absorbance at 450 nm in function of scFv concentration in nM. A is a positive control scFv.
