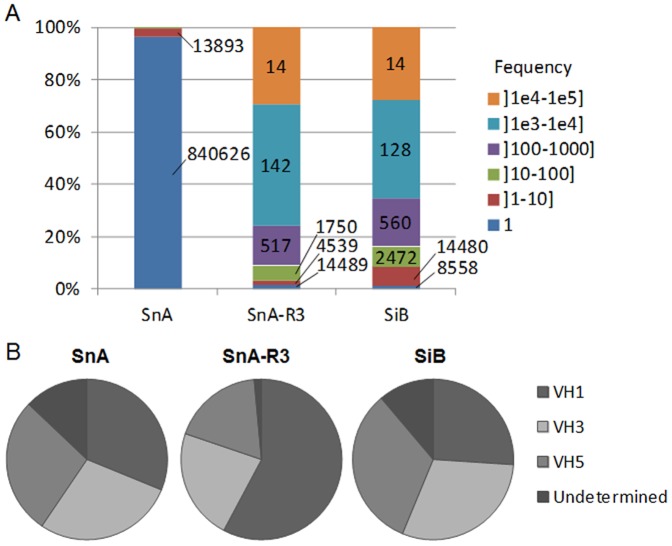
Figure 4. Analysis of synthetic CDRH3 diversity in SnA, SnA-R3 and SiB.
Evaluation by NGS of the diversity of synthetic CDRH3 from SnA, SnA-R3 and SiB (one million sequences were analyzed for each) and their repartition into human frameworks. (A) The percentage of CDRH3 in function of their frequency is represented by a color code. The values on the histograms are the number of unique CDRH3 corresponding to each section. (B) Frameworks repartition by family VH1, 3 or 5 in each library and in the selection round SnA-R3. Undetermined are sequences for which no framework could be attributed due to frame shifts.

