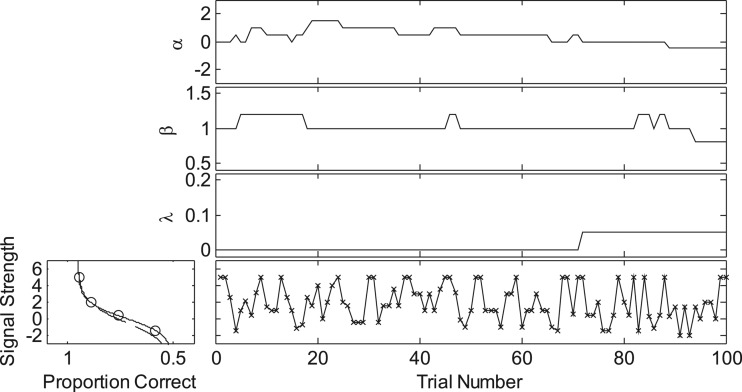
Figure 3.
A sample track using a random sweet-point selection rule. Left: the sweet points (circles) on the psychometric function of a virtual observer with α = 0, β = 1, γ = 0.5, and λ = 0.05 (solid curve), and the estimated psychometric function (dashed curve). Right: the maximum-likelihood estimates of α, β, and λ, as well as the signal strength (from top to bottom), in a simulated track that consists of 100 trials.

