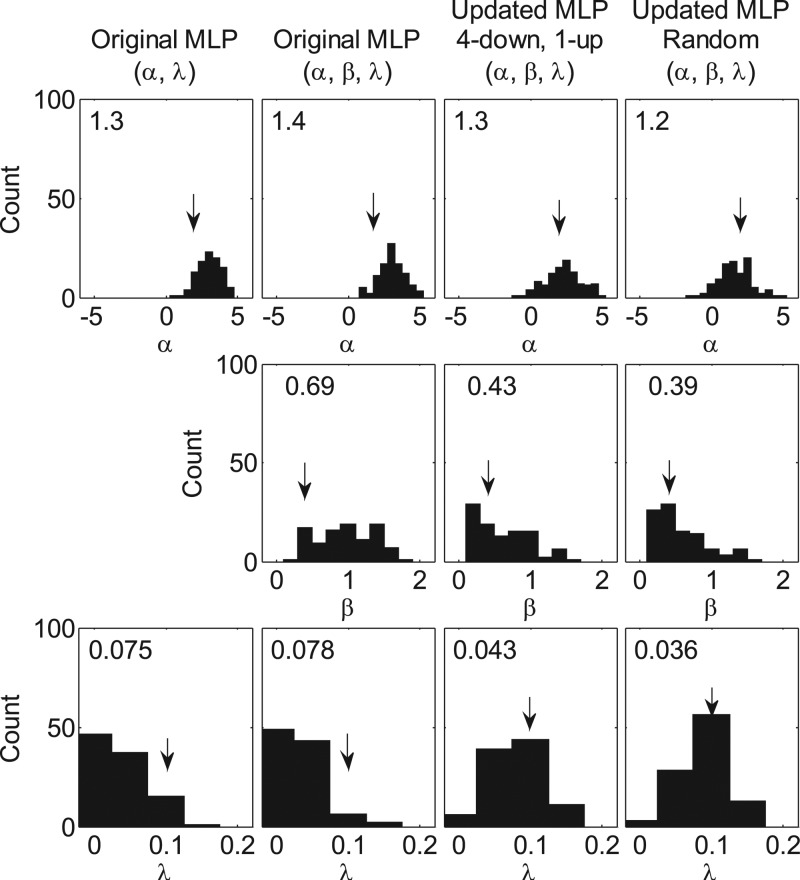
Figure 5.
Histograms of the α (top), β (middle), and λ (bottom) estimates from 100 Monte Carlo simulated procedures using the original maximum-likelihood procedure in which signal strengths are chosen based on just the α-sweet point (first two columns) or based on the updated method that samples four sweet points (last two columns). For the former, the candidate psychometric functions either did (2nd column) or did not (1st column) include the parameter β. For the updated procedures, the four sweet points were either sampled using a 4-down, 1-up algorithm or at random. The number inside each panel indicates the rms error of the estimates relative to the true value. The true psychometric function had parameters α = 2, β = 0.4, γ = 0.5, and λ = 0.1.

