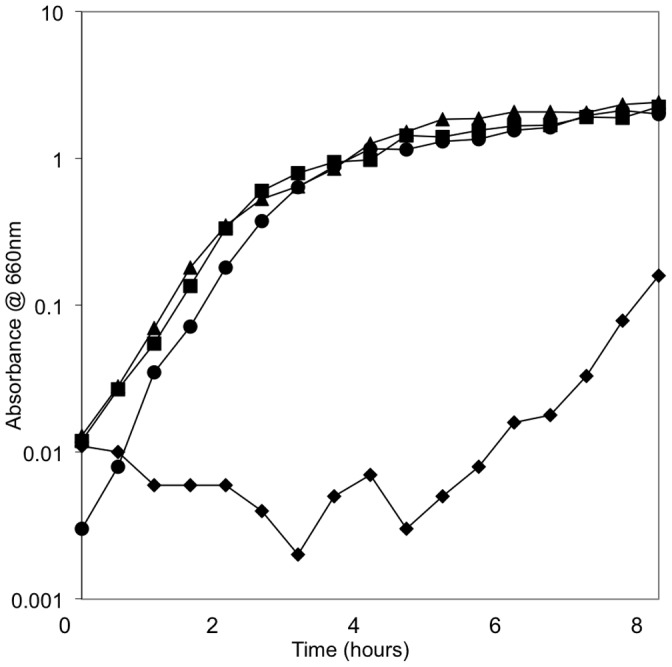
Figure 2. Growth of i518 and i519 in LB With 1% Salt and LB Without Added Salt.

Growth curves of i518 and i519 were repeated on three separate occasions. Spectrophotometric readings were taken every thirty minutes. i518 grown in LB-0: ⧫ i518 grown in LB-H: ▴, i519 grown in LB-0: ▪, i519 grown in LB-H: • Shown is a single representative graph.
