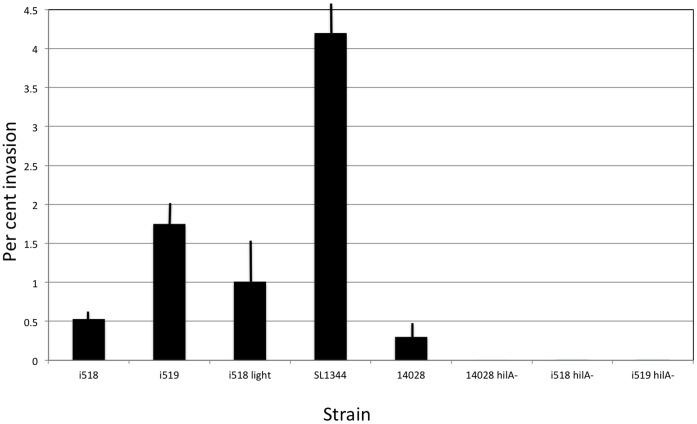
Figure 4. Results of invasion assays using Henle 407 cells.
Invasion assays were performed using the strains indicated. All final results represent the mean of 3 replicates. Error bars are +/− one standard deviation. The data is expressed as the percent of bacterial cells that invaded the Henle 407 cells. The hilA mutants were each used as negative controls as HilA is required for expression of genes involved in invasion.

