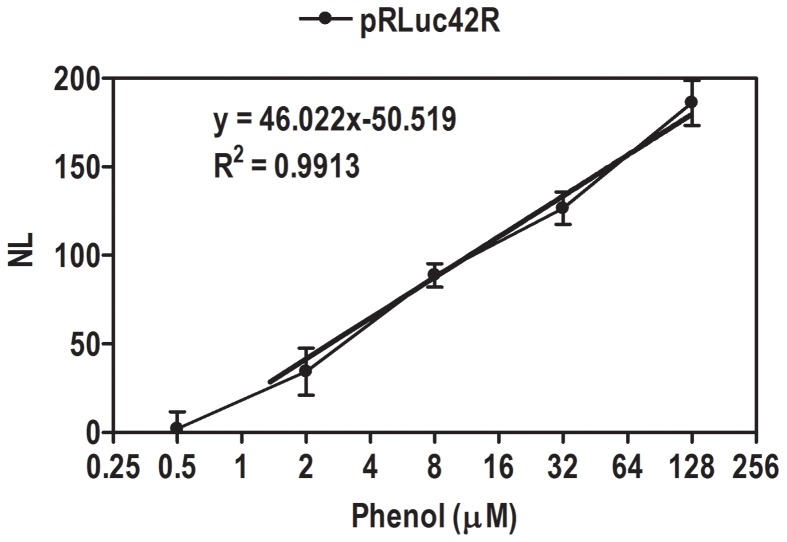
Figure 3. Lineariry curve is presented as phenol concentration v/s NL value of luminescence.
Firefly luciferase activities expressed in E. coli cells with pRLuc42R grown at different concentration of phenol. The pRLuc42R strain showed highly sensitive response at a low concentration of 0.5 µM. R2 = 0.9913. NL - Normalised luminescence, µM - Micro molar concentration.

