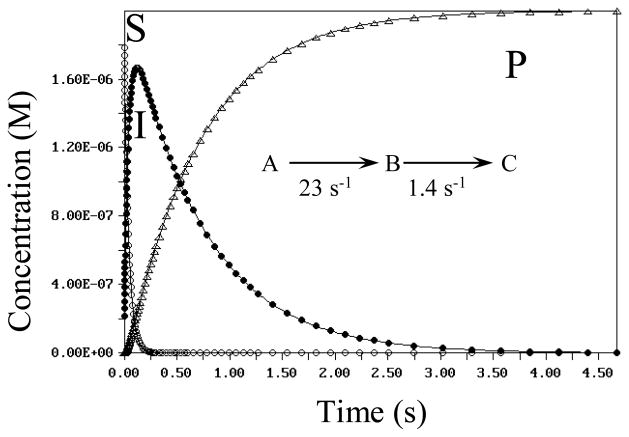
Figure 5.
Stopped flow analysis of the PR-AMP Cyclohydrolase enzymatic conversion: Plots (averages of triplicate runs) of the time vs. concentration for substrate, product and potential intermediate from global fit of the data to a two-step model A>B>C. Open circles (○) are substrate(S), closed circles (●) are intermediate (I), and open triangles (△) are product (P) as labeled.

