Figure 1.
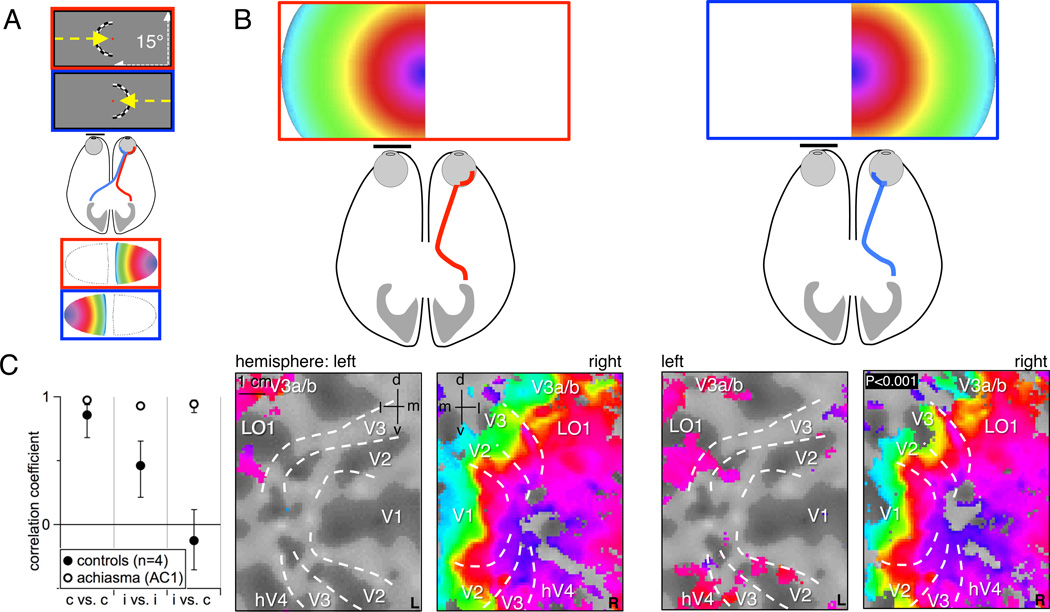
Hemifield retinotopic mapping results. A) Schematic of the normal projection pattern of the optic nerve of the right eye together with the visual contracting ring stimulus for hemifield eccentricity and its color-coded lateralized representation in a schematic V1-flatmap. The nasal retina (blue) projects to the contralateral and the temporal retina (red) to the ipsilateral hemisphere, resulting in a representation of each hemifield on its respective contralateral hemisphere. B) Schematic of the achiasmic optic nerve projection and eccentricity maps in AC1’s flattened representation of the early visual areas upon separate monocular stimulation of the right eye in the left and right visual hemifield. Responses are dominant in the right hemisphere and organized as an orderly eccentricity map for both visual hemifields. The visual area boundaries are indicated as determined from polar angle mapping (supplementary Figure S1). C) Correlation of the respective hemifield mappings to quantify the cortical superposition of hemifield maps in right V1 (mean±SD across four controls and for AC1 across repetitive correlations). In the controls the two repetitions of contralateral hemifield mappings were correlated (p<0.01) and, to a lesser degree (p<0.04), also those of two repetitions of ipsilateral hemifield mappings, but, in contrast, not those of contra- and ipsilateral field mappings. For AC1 both contra- and ipsilateral field mappings were highly correlated (p<0.001). See also supplementary Figure S1.

