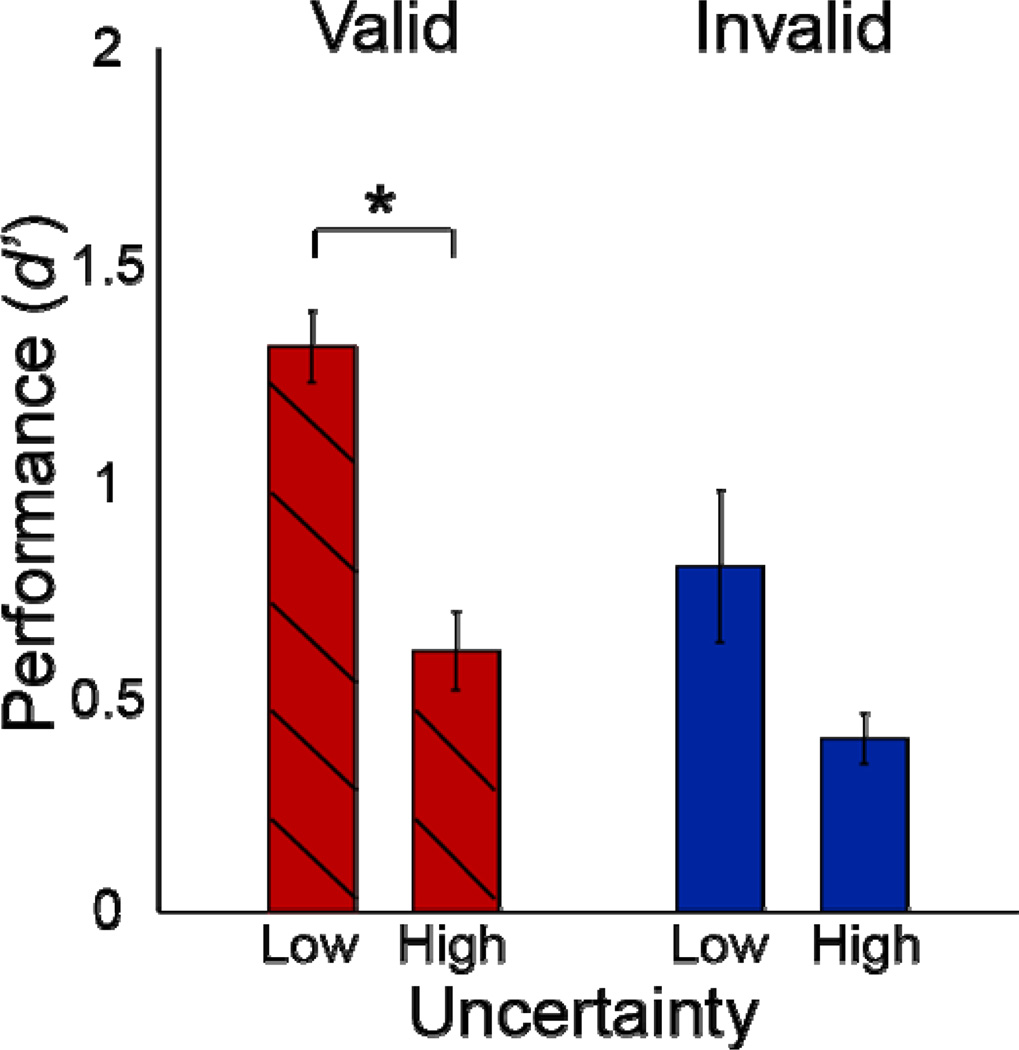
Figure 5. Uncertainty control experiment.
Performance as a function of uncertainty for valid pre-cues. Each bar represents the mean across observers, for trials with the same orientations in high- and low-uncertainty blocks. Error bars, ±1 s.e.m. (n=4 observers). * p<0.05, one-tailed t-test, Wilcoxon test.

